TCAD simulation I

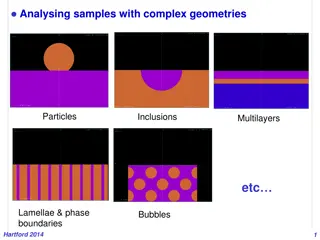
TCAD simulation plays a crucial role in the semiconductor industry, allowing for process and device simulations to meet market demands and reduce development time and costs. This involves modeling transport regimes, semiconductor equations, and electromagnetic fields to drive charge flow self-consistently. The training lectures in Oxford provide insights into various simulation techniques and tools used in the industry.

Download Presentation

Please find below an Image/Link to download the presentation.
The content on the website is provided AS IS for your information and personal use only. It may not be sold, licensed, or shared on other websites without obtaining consent from the author. Download presentation by click this link. If you encounter any issues during the download, it is possible that the publisher has removed the file from their server.
E N D
Presentation Transcript
TCAD simulation I E. Giulio Villani Instrumentation Training Lectures, Oxford 30/05/2023 1
Overview Introduction, needs for TCAD simulations Transport regimes and related equations Discretization techniques: meshing Discretization of semiconductor equations: Scharfetter-Gummel technique Examples Instrumentation Training Lectures, Oxford 30/05/2023
Introduction N++ implant P++ implant Epitax growth SiO2 etch TCAD (Technology Computer Aided Design) divides into three groups: Process simulation, i.e. simulation of fabrication process steps (oxidation, implantation, diffusion ) Device simulation, i.e. simulation of the thermal/electrical/optical behavior of electronic devices,(IV,CV, frequency response ) Device modeling, i.e. creating compact behavioral models for devices for circuit simulation (SPICE, Cadence ) Instrumentation Training Lectures, Oxford 30/05/2023 1
Introduction Reasons why TCAD simulations are needed: Market demands cycle of design to production of 18 months or less. Typically 2-3 months required for wafer tape out implies short time for development Reduce cost to run experiments on new devices and circuits Shrinking product life cycles in semiconductor industry over time Instrumentation Training Lectures, Oxford 30/05/2023 2
Introduction Electronic structure/lattice dynamics Main components of semiconductor device simulation include description of electronic structure, driving forces and transport phenomena Transport equations Electromagnetic Fields The two kernels of semiconductor transport equations and fields that drive charge flow are coupled to each other and needs solving self- consistently Device simulation Instrumentation Training Lectures, Oxford 30/05/2023 3
Transport regimes Usually only the quasi-static electric fields from the solution of Poisson s equation are necessary for EM solutions Transport regime in semiconductors depends on length scale L: device length le-e: electron-electron scattering length le-ph: electron-phonon scattering length : electron wavelength Modern Silicon technology already requires tools to describe transport in quantum regime [D. K. Ferry and S. M. Goodnick, Transport in Nanostructures, 1997] Instrumentation Training Lectures, Oxford 30/05/2023 4
Transport regimes ?? <?>~ 1.2 ?? ?????????? ?????? ??? ??? ?? ??(Segre , Nuclei and Particles, Vol. II) ?~ 2? ? =?? ? 1 Charge carrier dynamics in Si detectors usually does not require QM ??2?~2 1019 ? ???? ??????? ??? ?? ?????????? ?????? ??? ? 1/3~3.6 ?? ??? ?? Semiclassical laws of motions apply ~ 0.38 ?? @10 ? 0.12 ?? @100 ??? ??????? ????????? ?? ???????? @ ???? ????????? ? 2???? Drift-diffusion equations are valid, provided the electron gas is in thermal equilibrium with lattice temperature (Tn = TL) Instrumentation Training Lectures, Oxford 30/05/2023 5
Drift diffusion model ??? The semiconductor equations derived from 1st moment of BTE are referred to as Drift Diffusion model ??????? The model consists of Poisson's equation, continuity and current density equations for electrons and holes ?????????? They express charge and momentum conservation ??????? ??????? Their self-consistent solutions are obtained via discretization, using finite element methods (FEM) Instrumentation Training Lectures, Oxford 30/05/2023 6
Discretization and meshing The device simulations process consists of two steps: 1: The test volume is obtained through grid generation ( mesh generation ) 2: Solve the discretized differential equations using Finite-Boxes method (box integration method) . This method integrates PDEs over the test volume. Instrumentation Training Lectures, Oxford 30/05/2023 7
Discretization and meshing The Delaunay triangulation with all the circumcircles and their centres The meshing used in most finite elements methods (FEM) relies on Delaunay triangulations: the interior of the circumsphere of each element contains no mesh vertices. The Delaunay triangulation of a discrete point set P in general corresponds to the dual graph of the Voronoi diagram for P Connecting the centres of the circumcircles produces the Voronoi diagram (in red). the set of all locations x closest to Pi than to any other point of the grid Instrumentation Training Lectures, Oxford 30/05/2023 8
Voronoi boxes do not overlap (each circumcircle does not include a point of another triangle). Each can be uniquely assigned to its corresponding grid points. Discretization and meshing ??= ?? Correct Delaunay triangulation guarantees element-volume conservation, important in many problems (diffusion, charge generation, et cetera) Voronoi boxes do overlap (each circumcircle does include a point of another triangle). Each cannot be uniquely assigned to its corresponding grid points. Wrong volumes calculated Delaunay triangulation maximizes the minimum angle. ?1= ?1+?5+ ?6 ?3= ?3+?5+ ?6 Instrumentation Training Lectures, Oxford 30/05/2023 9
Discretization and meshing Discretization of equations imposes some constraints on spatial and temporal mesh size ????? ?2? ????? ????? ??= Mesh size should be smaller than Debye length (i.e. the characteristic length for screening of field by charges) where charge variations in space have to be resolved ? = 1013[?? 3]:?? 1.3 ?? @? = 300 ? ? = 1017[?? 3]:?? 13 ?? @? = 300 ? ? = 1019[?? 3]:?? 1.3 ?? @? = 300 [?] Instrumentation Training Lectures, Oxford 30/05/2023 10
Discretization and meshing ?? ???~ ????????????? ?????????? ???? ? = 1013[?? 3],?? 1400 [?? 3? 1? 1@? = 300 ? : ??? 400 ?? Also temporal mesh size should be smaller than the dielectric relaxation time tdr (i.e. time it takes to charge fluctuations to decay under the field they produce) ? = 1015[?? 3],?? 1350 [?? 3? 1? 1@? = 300 ? : ??? 4.8 [??] ? ? ?? = ?(? = 0) ? ? = ? 0 ? ?(0) ??? Time interval ? bigger than tdr might give unrealistic transient results ( oscillations in estimated transient currents) ??? Instrumentation Training Lectures, Oxford 30/05/2023 11
Box integration method ? ? ? Discretization of Poisson s and continuity equations is done via Box Integration method ? ?? = ??? The LHS of equations is transformed via Gauss theorem and integrated over a Voronoi box k of point Pk Instrumentation Training Lectures, Oxford 30/05/2023 12
? Box integration method ?? ?? ?? ?? ?? ? ? ?? Example of Poisson s discretization ?,?,?:????? ??????? ??,??, ??:???? ??????? Assume that the electric potential is linearly varying over each elementary domain ??,??, ??:????????? ???? ??????? ? ? ????:?????????? ????????? Instrumentation Training Lectures, Oxford 30/05/2023 13
? Box integration method ?? ?? ?? ?? ?? Components of D vector along sides Li,j,k ? ? ?? Flux of D vector associated to node k: ??? ? ??? ? ??? ? 1 ?? 1 ?? 1 ?? ?? ?? ?? ?? ?? ?? Discretization of RHS is obtained by multiplying the node value of charge by the area of the portion of the Voronoi box ?? (?? ??) ?? ?? ??? ???[?? ?? ??+ ?? ??] ???? ?? ? ?? Instrumentation Training Lectures, Oxford 30/05/2023 14
Box integration method ? ? ? ???:???? ?? ? ???? ???:?????????? ????? ???? ???? ??????= ???? ? Summing over all points Pk of Voronoi boxes ??,?????= ?(??+? ????)?? ? Same approach to discretize continuity equations for electrons and holes ??,?????= ?(??+? ????)?? ? Instrumentation Training Lectures, Oxford 30/05/2023 15
? Scharfetter-Gummel discretization ?? ?? ?? ?? ?? In case of no strong generation- recombination current density varies little within each domain ? ? ?? Still this implies an exponential dependence of electron / hole density with position along grid s edge ? ?? ??? ? ???? ?? Using previous discretization method would require very dense mesh: Scharfetter-Gummel technique includes such dependence, requiring less grid points [D. L. Scharfetter and H. K. Gummel, Large-signal analysis of a silicon read diode oscillator, IEEE Trans. Electron Devices, vol. ED- 16, pp. 64 77, Jan. 1969]. ? ?? ???[ ? ? ?] from ?? ??? ???[?? ??? ?????????? ????? ??~ ???????? ???] ??? Instrumentation Training Lectures, Oxford 30/05/2023 16
? Scharfetter-Gummel discretization ?? ?? ?? ?? ?? ? ? ?? Assume u varies linearly along the edge and current density constant over the domain ? =?? ?? ??+ ??= ????+ ?? ?? Define reduced current and assume and average diffusion along the edge ??? ????, ???:= ??? < ???,???> Obtain first order equation in n along the edge ?? ??? ???= ??? Instrumentation Training Lectures, Oxford 30/05/2023 17
? Scharfetter-Gummel discretization ?? ?? ?? ?? ?? ? ? ?? ?? ?? ?? ??? Integrate from node i to node j, i.e. for lk=[0, Lk] exp( ????) ???= exp( ????) ??? ? ?? 0 0 ??? ??? = (exp( ????)?)??? 0 Obtain expression relating potential and carriers concentration 1 ,???= ?? ?? ??? ??(1 exp( ???) =exp( ???)?? ?? ?? ?? ???= ??( exp(???) 1+ exp( ???) 1) Instrumentation Training Lectures, Oxford 30/05/2023 18
? Scharfetter-Gummel discretization ?? ?? ?? ?? ?? ? ? Obtain the flux of current density relative to node k ?? ????? ????? 1 ?? ???= ( exp(???) 1 exp(???) 1) Scharfetter Gummel discretization requires less fine mesh as the exponential dependence of carriers concentration is included in the discretization scheme 1 ?? ? ???= (?(???)?? ?(???)??) ????????? ???????? ? ? := exp ? 1 ??? It also depends on boundary values, i.e. 2D and 3D cases can be reduced to local 1D cases ?? ?? ?? ?? = e??? (?(???)?? ? ???)?? + e??? (?(???)?? ?(???)??) Instrumentation Training Lectures, Oxford 30/05/2023 19
Simulation examples Examples from Synopsys TCAD (more on this from N. Owen lectures) Beside electrical simulations, simulation of processes of device fabrication is possible Simulated process steps for LGAD fabrication Most of the typical fabrication process steps can be simulated Nwell Nwell-GR P-epi p++ Instrumentation Training Lectures, Oxford 30/05/2023 20
Simulation examples SIMS and Pearson IV distribution 31P High energy implants of ions can be simulated, either analytically or via MC Creation of defects following implantation can be simulated SIMS, Pearson IV distribution and MC run 11B Instrumentation Training Lectures, Oxford 30/05/2023 21
Simulation examples At least with As, MC (SRIM) and SPROCESS predictions on doping seem to agree within 20% Note: SRIM assumes amorphous Si, <100> used for SPROCESS, but 1D SRIM (Stopping and Range of Ions in Matter, http://www.srim.org/) Instrumentation Training Lectures, Oxford 30/05/2023 22
Simulation examples Electrical simulation of a CMOS sensors (OVERMOS) Photograph of OVERMOS test structure and simulated cell 40um A TCAD model of fabrication process of OVERMOS has been developed to investigate and predict the performances of the sensor 40um Photograph of OVERMOS cell and .gds layout Instrumentation Training Lectures, Oxford 30/05/2023 23
SiPoly to simulate non reflective BC Simulation examples Vbias T = 300 K Internal field configuration vs. bias and temperature GND 3D simulated cell Xsection showing potential and depletion Vbias = 10 V DC and AC characteristics can be obtained from the simulated model Surface plot of x-field and depletion Vbias = 10 V Instrumentation Training Lectures, Oxford 30/05/2023 24
Simulation examples Charge collection is simulated using laser light injection and compared with test results Test setup for charge collection measurement Laser beam is 5 x 5 um2 around 4.5 ns pulse width, 1064 nm wavelength, ~ 10 ?? These values are introduced in the simulator Charge is injected via laser at three different locations on cell. Results are mirrored to obtain a map of collected charge vs. position Instrumentation Training Lectures, Oxford 30/05/2023 25
Simulation examples Effects of SiO2 reflection and attenuation of IR light can be implemented Quantum yield of optical generation, polarization, tilting, pulse width et cetera can all be included in the simulation Transient of charge collection measurement and simulation TCAD OVERMOS reproduce experimental results, both in DC and in CC, with maximum discrepancy of the order of 20% simulations of non-irradiated Instrumentation Training Lectures, Oxford 30/05/2023 26
TCAD and simulation I Introduction to simulation Needs and transport regimes Meshing and discretization. Intro to DD model discretization. SG method Some examples of TCAD simulations: process and electrical device simulations, charge collection Thank you giulio.villani@stfc.ac.uk Instrumentation Training Lectures, Oxford 30/05/2023 27