Understanding Stock Market Concepts: Distributions, Skewness, and More

Explore key concepts in the stock market such as return distributions, skewness, kurtosis, and correlation between stocks. Gain insights into potential sector ideas and market risks for informed investing decisions.

Download Presentation

Please find below an Image/Link to download the presentation.
The content on the website is provided AS IS for your information and personal use only. It may not be sold, licensed, or shared on other websites without obtaining consent from the author. Download presentation by click this link. If you encounter any issues during the download, it is possible that the publisher has removed the file from their server.
E N D
Presentation Transcript
We all chase money because we are afraid to chase dreams Andres Ramirez Ph.D.
A few things On telling it like it is On team work versus individual work On your first assignment What on paper What on file What companies are not allowed On the homework
What stocks not to include The ones we included Netflix Bank of America JP Morgan Tesla
Potential Sector Ideas Fixed Income Asia (ex China / Japan) South America MENAP AFRICA Commodities NAFTA Brexit TPP REITs TAX reform Trade war Crypto-currencies Your own?
Plan for the day Company screeners / universe Teams working on Policy Statements Region Sector Cooking show file Normality Assumptions Market returns Create a Portfolio and calculate returns & Stdev Market Risk vs stand alone risk DDM constant growth and super-normal
What we do know about the stock market link
On Skew, Kurtosis and other weird terms Andres Ramirez, Ph.D.
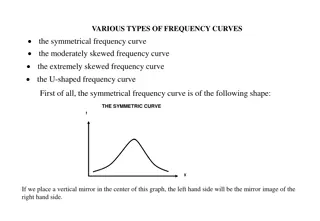
Return Distributions cont. Skew >0 Right / Positive Skew = 0 symmetrical Skew < 0 Left / Negative Right Skew
Return Distributions cont. Kurt>3 Leptokurtic Kurt=3 Mesokurtic Kurt < 3 Platykurtic
Returns Distribution for Two Perfectly Negatively Correlated Stocks ( = -1.0) 8-13
Returns Distribution for Two Perfectly Positively Correlated Stocks ( = 1.0) Stock M Portfolio MM Stock M 25 25 25 15 15 15 0 0 0 -10 -10 -10 8-14
Creating a Portfolio: Beginning with One Stock and Adding Randomly Selected Stocks to Portfolio p decreases as stocks added, because they would not be perfectly correlated with the existing portfolio. Expected return of the portfolio would remain relatively constant. Eventually the diversification benefits of adding more stocks dissipates (after about 10 stocks), and for large stock portfolios, p tends to converge to 20%. 8-16
Illustrating Diversification Effects of a Stock Portfolio 8-17
Breaking Down Sources of Risk Stand-alone risk = Market risk + Diversifiable risk Market risk portion of a security s stand- alone risk that cannot be eliminated through diversification. Measured by beta. Diversifiable risk portion of a security s stand-alone risk that can be eliminated through proper diversification. 8-18
Failure to Diversify If an investor chooses to hold a one-stock portfolio (doesn t diversify), would the investor be compensated for the extra risk they bear? NO! Stand-alone risk is not important to a well-diversified investor. Rational, risk-averse investors are concerned with p, which is based upon market risk. There can be only one price (the market return) for a given security. No compensation should be earned for holding unnecessary, diversifiable risk. 8-19
Capital Asset Pricing Model (CAPM) Model linking risk and required returns. CAPM suggests that there is a Security Market Line (SML) that states that a stock s required return equals the risk-free return plus a risk premium that reflects the stock s risk after diversification. ri = rRF + (rM rRF)bi Primary conclusion: The relevant riskiness of a stock is its contribution to the riskiness of a well-diversified portfolio. 8-20
Beta Measures a stock s market risk, and shows a stock s volatility relative to the market. Indicates how risky a stock is if the stock is held in a well-diversified portfolio.
Comments on Beta If beta = 1.0, the security is just as risky as the average stock. If beta > 1.0, the security is riskier than average. If beta < 1.0, the security is less risky than average. Most stocks have betas in the range of 0.5 to 1.5.
Can the beta of a security be negative? Yes, if the correlation between Stock i and the market is negative (i.e., i,m < 0). If the correlation is negative, the regression line would slope downward, and the beta would be negative. However, a negative beta is highly unlikely.


")