Descriptive Statistics in Research
Descriptive statistics are essential in summarizing and analyzing large datasets to uncover trends and tendencies within the data. They include measures of central tendency, dispersion, and skewness, aiding in better understanding and communicating research results. Frequency distributions provide i
1 views • 32 slides

Image Histograms and Modifications
Image histograms provide valuable insights into the nature of images, with characteristics like width, skewness, and peaks revealing information about contrast, brightness, and objects within. Different types of histograms indicate varying image attributes, aiding in tasks like threshold parameter s
1 views • 13 slides
Dotplots for Displaying Quantitative Data
Learn how to create and interpret dotplots for quantitative data visualization. This lesson covers making dotplots, describing distribution shapes, and comparing data sets. Explore the simplicity and effectiveness of dotplots in representing numerical information. Gain insights into analyzing dotplo
1 views • 14 slides

Tackling Skewed Data Challenges in Decentralized Machine Learning
Addressing the critical issue of skewed data in decentralized machine learning, this work explores solutions to effectively handle non-iid data distribution, focusing on communication bottlenecks, data skewness, and proposing innovative approaches for decentralized learning over skewed datasets.
0 views • 26 slides
The Normal Probability Curve
The Normal Probability Curve, also known as the normal distribution, is a fundamental concept in statistics. It is symmetric around the mean, with key characteristics such as equal numbers of cases above and below the mean, and the mean, median, and mode coinciding. The curve's height decreases grad
1 views • 10 slides
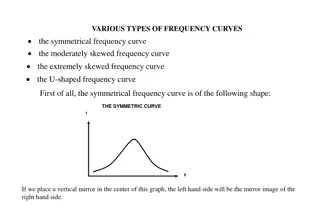
Various Types of Frequency Curves in Statistics
Explore different types of frequency curves such as symmetrical, moderately skewed, extremely skewed, and U-shaped curves. Symmetrical curves exhibit mirror images on either side, while skewed curves have longer tails on one side. Extreme skewness results in J-shaped or reverse J-shaped curves. The
1 views • 8 slides
Key Statistics Concepts in Data Analysis
Explore the essential statistics concepts including mean, median, mode, variance, standard deviation, skewness, and how they are computed for both discrete and continuous data sets. Learn the importance of these measures in analyzing data and making informed decisions.
1 views • 11 slides

Stock Market Concepts: Distributions, Skewness, and More
Explore key concepts in the stock market such as return distributions, skewness, kurtosis, and correlation between stocks. Gain insights into potential sector ideas and market risks for informed investing decisions.
0 views • 24 slides

Descriptive Statistics in Data Analysis
Descriptive statistics involve measuring and analyzing data to describe its features and characteristics. This includes means, medians, modes, maxima, minima, quartiles, quantiles, percentiles, variance, standard deviation, skewness, and kurtosis. These statistics provide insights into the spread, c
0 views • 7 slides

Statistical Analysis: Descriptive and Inferential Techniques Overview
Understanding statistical analysis involves both descriptive and inferential techniques. Descriptive statistics focus on summarizing data, including measures of central tendency and dispersion. In contrast, inferential statistics use sample data to make inferences about populations and test hypothes
1 views • 19 slides
Statistical Modeling and Analysis
Exploring statistical concepts such as mean, variance, skewness, kurtosis, Gaussian distribution, least squares fitting, chi-square fitting, and goodness-of-fit in data analysis. Learn about fitting parameters, probability computation, and interpretation of model goodness.
1 views • 24 slides
Normal Reference Range and Descriptive Statistics in Medicine
The concept of normal reference range in medicine, determined by collecting data from a population, helps predict intervals where values are expected to fall. Descriptive statistics like mean, variance, skewness, and kurtosis provide insights into data distributions. Methods for calculating referenc
0 views • 45 slides
Analysis of Quantile Regression on LPGA Prize Winnings for 2009/2010 Seasons
This analysis focuses on using Quantile Regression to study professional female golfers' prize earnings in the Ladies Professional Golf Association (LPGA) during the 2009 and 2010 seasons. The study investigates how various factors like average driving distance, fairway accuracy, greens in regulatio
2 views • 11 slides

Analysis of Average and Median Salaries for Full-Time Faculty in Massachusetts Community Colleges
The report highlights the average and median salaries for full-time faculty members in Massachusetts community colleges for the year 2023. It compares the salaries across different colleges and ranks, noting changes from previous years. The distribution of salaries appears relatively balanced withou
0 views • 26 slides
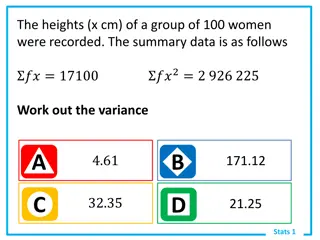
Analysis of Summary Data: Heights, Distributions, Regression Lines, and Correlation Coefficients
Various statistical concepts including variance calculation, expected values in random variables, regression line equations, product moment correlation coefficients, skewness, probability events, and standard deviation formulas.
0 views • 15 slides

Normal Distribution Characteristics
The content includes review questions on normal distribution characteristics, skewness, kurtosis, Z-scores, and detecting non-normality using various graphs. It covers topics like symmetry, bimodality, bell shape, mean-median-mode relationship, skewness, kurtosis, Z-score calculation, and normalizat
0 views • 7 slides

Checking for Normality in Data Analysis
When faced with data analysis tasks involving variables whose distribution is not explicitly stated, it becomes necessary to check for normality. This involves methods like constructing histograms, assessing skewness, and detecting outliers. Through examples involving technology inventories and base
0 views • 10 slides

Statistical Analysis on Pile Length Data
Calculating range, variation, standard deviation, mean deviation, and skewness measure from a table showing pile lengths and frequencies. The process involves finding the range, variation, mean, mean deviation, and skewness using mathematical formulas. The step-by-step analysis includes determining
0 views • 6 slides
Generalized Parton Distributions through Universal Moment Parameterization: Towards Global Analysis
This research focuses on the GUMP method for analyzing Generalized Parton Distributions at non-zero skewness. The study, led by M. Gabriel Santiago and team, utilizes universal moment parameterization to advance global analysis in high-energy physics.
0 views • 27 slides

Assessing Normality, Dealing with Non-Normal Data, and Handling Missing Data
Explore methods for assessing normality, detecting non-normal data, and managing missing data in research studies. Learn about skewness, kurtosis, outliers, and transformations to address non-normal data effectively. Understand the importance of data logs in recording activities and making necessary
2 views • 24 slides
Understanding Data Summarization: Central Tendency, Distribution, Skewness, and Kurtosis
Explore the essentials of data summarization, including measurements of central tendency like mean, mode, and median, distributions, skewness, and kurtosis. Learn how to interpret and analyze data effectively.
0 views • 30 slides

Analysis of Medical Education Assessment Results at Ibn Sina College
Explore the assessment results and histograms for the medical education program at Ibn Sina National College. Dive into the distribution of grades among male and female students, along with interpretations of skewness, kurtosis, and possible solutions for abnormalities.
0 views • 4 slides
Understanding Descriptive Statistics and Skewness in Data Analysis
Explore the concepts of shape, skewness, and the impact of outliers on statistical measures like mean, median, and mode. Learn how to interpret skewness in datasets and examine the practical application of descriptive statistics using examples and tools like MS Excel.
0 views • 28 slides