Solutions for Imperfect Population Movement Data Analysis
James Raymer, representing the IMEM team, discusses solutions for handling imperfect data on population movements at the Australian Demographic and Social Research Institute. Double-entry matrices for selected countries in 2003 are presented, depicting flows between destination and origin countries, aiding in population modeling research.

Download Presentation

Please find below an Image/Link to download the presentation.
The content on the website is provided AS IS for your information and personal use only. It may not be sold, licensed, or shared on other websites without obtaining consent from the author. Download presentation by click this link. If you encounter any issues during the download, it is possible that the publisher has removed the file from their server.
E N D
Presentation Transcript
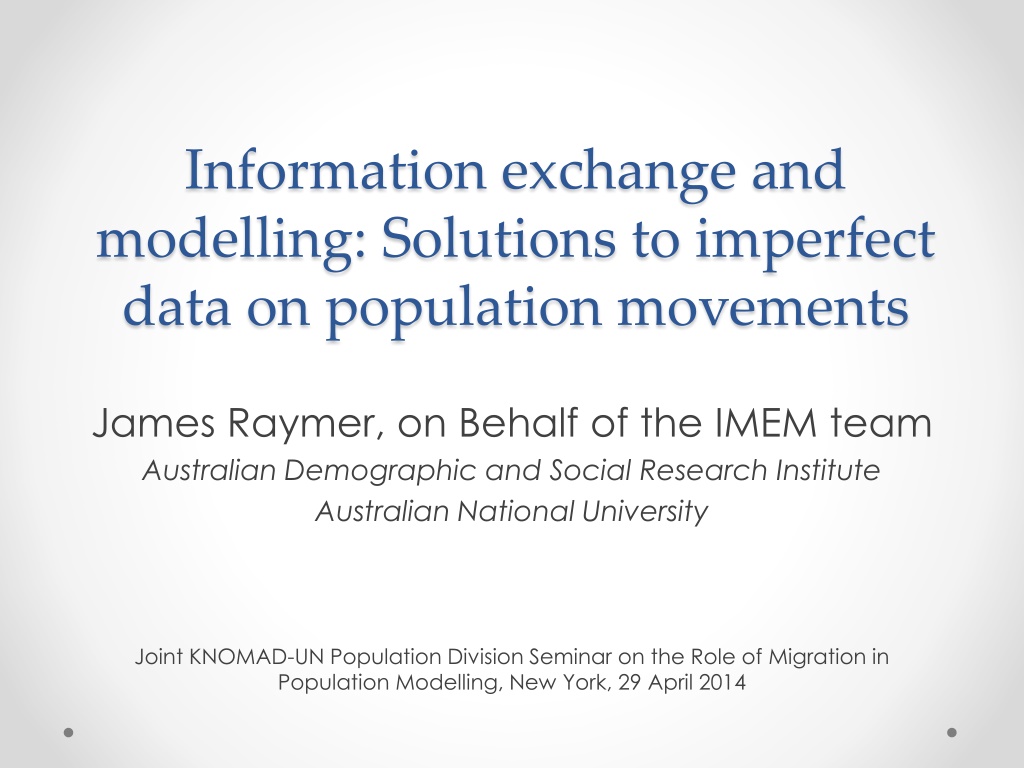
Information exchange and modelling: Solutions to imperfect data on population movements James Raymer, on Behalf of the IMEM team Australian Demographic and Social Research Institute Australian National University Joint KNOMAD-UN Population Division Seminar on the Role of Migration in Population Modelling, New York, 29 April 2014
Double-entry matrix for selected countries, 2003 Destination Origin BE BE CZ DK DE 4291 EE GR ES 3037 FR IE IT 1959 I E I E I E I E I E I E I E I E I E I E 80 587 232 47 2 66 229 31 CZ 78 511 9258 950 2693 2540 388 70 764 1720 13746 16236 915 197 281 782 283 1333 DK 65 180 1228 8909 133 597 264 2415 DE 3221 2712 169 12902 33802 103 4623 18106 19060 EE 4 947 60 273 57 GR 278 1665 130 1488 12959 4 638 2051 801 4647 ES 103 34 462 45 274 20 14647 2109 18133 38 211 647 1414 2474 487 FR 8847 IE 306 895 155 2046 1649 292 IT 23702 9778 5796 895 1 2933 130 I = Receiving country s reported flow; E = sending country s reported flow; = no reported data available
Double-entry matrix for selected countries, 2003 Destination Origin BE BE CZ DK DE 4291 EE GR ES 3037 FR IE IT 1959 I E I E I E I E I E I E I E I E I E I E 80 587 232 47 2 66 229 31 CZ 78 511 9258 950 2693 2540 388 70 764 1720 13746 16236 915 197 281 782 283 1333 DK 65 180 1228 8909 133 597 264 2415 DE 3221 2712 169 12902 33802 103 4623 18106 19060 EE 4 947 60 273 57 GR 278 1665 130 1488 12959 4 638 2051 801 4647 ES 103 34 462 45 274 20 14647 2109 18133 38 211 647 1414 2474 487 FR 8847 IE 306 895 155 2046 1649 292 IT 23702 9778 5796 895 1 2933 130 I = Receiving country s reported flow; E = sending country s reported flow; = no reported data available
Double-entry matrix for selected countries, 2003 Destination Origin BE BE CZ DK DE 4291 EE GR ES 3037 FR IE IT 1959 I E I E I E I E I E I E I E I E I E I E 80 587 232 47 2 66 229 31 CZ 78 511 9258 950 2693 2540 388 70 764 1720 13746 16236 915 197 281 782 283 1333 DK 65 180 1228 8909 133 597 264 2415 DE 3221 2712 169 12902 33802 103 4623 18106 19060 EE 4 947 60 273 57 GR 278 1665 130 1488 12959 4 638 2051 801 4647 ES 103 34 462 45 274 20 14647 2109 18133 38 211 647 1414 2474 487 FR 8847 IE 306 895 155 2046 1649 292 IT 23702 9778 5796 895 1 2933 130 I = Receiving country s reported flow; E = sending country s reported flow; = no reported data available
Double-entry matrix for selected countries, 2003 Destination Origin BE BE CZ DK DE 4291 EE GR ES 3037 FR IE IT 1959 I E I E I E I E I E I E I E I E I E I E 80 587 232 47 2 66 229 31 CZ 78 511 9258 950 2693 2540 388 70 764 1720 13746 16236 915 197 281 782 283 1333 DK 65 180 1228 8909 133 597 264 2415 DE 3221 2712 169 12902 33802 103 4623 18106 19060 EE 4 947 60 273 57 GR 278 1665 130 1488 12959 4 638 2051 801 4647 ES 103 34 462 45 274 20 14647 2109 18133 38 211 647 1414 2474 487 FR 8847 IE 306 895 155 2046 1649 292 IT 23702 9778 5796 895 1 2933 130 I = Receiving country s reported flow; E = sending country s reported flow; = no reported data available
Introduction Since 2007, there have been two international and interdisciplinary projects on estimating international migration flows in Europe o MIMOSA funded by Eurostat, 2007-2009 o IMEM funded by New Opportunities for Research Funding Agency Co-operation in Europe (NORFACE), 2009-2012
IMEM project The project brought together expertise in modelling, data and uncertainty o Southampton Statistical Sciences Research Institute James Raymer (PI), Jon Forster, Peter Smith, Jakub Bijak and Arkadiusz Wi niowski o Netherlands Interdisciplinary Demographic Institute Rob van der Erf, Janette Schoorl and Joop de Beer o University of Oslo Nico Keilman and Solveig Christiansen
IMEM design Bayesian model for harmonising and correcting the inadequacies in the available data and for estimating the completely missing flows The methodology is integrated and capable of providing measures of uncertainty Key aspects of our methodology: o Development of the underlying statistical framework o Elicitation and inclusion of relevant expert prior information Scope: flows amongst 31 European countries by age and sex, 2002-2008 Adopted definition according to United Nations 1998 recommendation
Origin-destination (OD) model Expert opinion Expert opinion
Posterior densities of the estimated true migration flows for selected countries, 2006
Posterior densities of selected migration flows, 2006
Median estimates of selected true flows (solid), reported emigration (cross) and reported immigration (circle), 2002-2008
Top ten median flows from Poland, 2002 Rest of world Top ten flows = 93.9% of total (145,988)
Top ten median flows from Poland, 2003 Rest of world Top ten flows = 93.8% of total (145,186)
Top ten median flows from Poland, 2004 Rest of world Top ten flows = 93.6% of total (251,636)
Top ten median flows from Poland, 2005 Rest of world Top ten flows = 93.4% of total (267,065)
Top ten median flows from Poland, 2006 Rest of world Top ten flows = 92.5% of total (253,427)
Top ten median flows from Poland, 2007 Rest of world Top ten flows = 91.8% of total (272,928)
Top ten median flows from Poland, 2008 Rest of world Top ten flows = 91.7% of total (293,059)
Top ten median flows from Poland, 2008 Rest of world Interquartile ranges Total flow: 270,149 - 381,093 ~ 19% +/- from median Red: ~ 28% +/- Green: ~ 10% +/-
Estimated Finland to Germany migration by age and sex, 2006
Summary We produced a set of harmonised and complete estimates of migration by origin, destination, age and sex for the 31 countries in the EU and EFTA from 2002-2008 Some results are available on the internet o http://www.cpc.ac.uk/research_programme/IMEM_project.php Our plan is to continue improving and expanding the model as new funding and data become available
Contributions of the IMEM project A methodology for estimating harmonised flows of international migration by age and sex Integration of a measurement model with covariate information and expert judgments to estimate missing flows Estimates include measures of uncertainty
Usefulness of an integrated migration estimation system Single resource for policy making and research Reference for data validation Platform for sharing information, harmonising definitions and removing inconsistencies A data source for countries with inadequate collection systems
Main conclusions Reported flows on international migration data are highly inconsistent and incomplete Expert knowledge on data collection systems is needed to understand the reported flows Real improvements in the data requires information exchange between national statistical offices In the absence of communication, statistical modelling is necessary to reconcile inconsistent data and to estimate missing data Uncertainty measures are necessary for understanding the quality of the estimates
Forecasting: Argument for origin- destination migration flow tables Net migration totals (or rates) do not exhibit regularities across age and space that you can depend on Forecasts of net migration result in biased population projections Reported net migration totals are not simply the difference between immigration and emigration; they contain administrative corrections and other unknown quantities Although more cumbersome, flow tables provide flexibility and access to better checks and validation (e.g., origin-destination migrant stock data)


 model")
 model")