Impact of Payment for Performance Programs in Healthcare
Payment for Performance (P4P) programs in healthcare have assumptions that performance can be accurately measured, individual variation is due to motivation, financial incentives enhance intrinsic motivation, the current payment system is too simplistic, and poor quality care providers should receive fewer resources. However, these programs have led to penalties for doctors caring for high-needs patients, quality scores reflecting patient characteristics, increased documentation but not real counseling rates, rising death rates with readmission penalties, and no decrease in hospital mortality in England despite P4P implementation.

Download Presentation

Please find below an Image/Link to download the presentation.
The content on the website is provided AS IS for your information and personal use only. It may not be sold, licensed, or shared on other websites without obtaining consent from the author. Download presentation by click this link. If you encounter any issues during the download, it is possible that the publisher has removed the file from their server.
E N D
Presentation Transcript
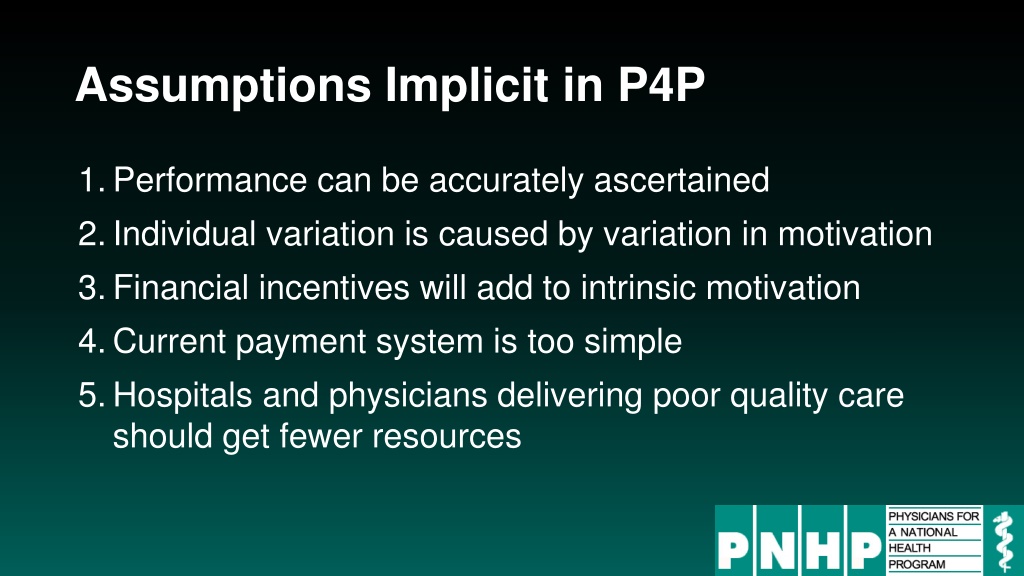
Assumptions Implicit in P4P 1.Performance can be accurately ascertained 2.Individual variation is caused by variation in motivation 3.Financial incentives will add to intrinsic motivation 4.Current payment system is too simple 5.Hospitals and physicians delivering poor quality care should get fewer resources
Medicare Value-Based Payment Program Penalizes Doctors Caring for High-Needs Patients 18.0% Percent of practices penalized* 13.1% 9.8% 3.1% Poorer Sicker Not Sick, Sicker + Characteristics of Practices Patients Source: JAMA 2017;318:453 * Note: Estimate based on simulation of penalties under mandatory Physicians Value-Based Payment Modifier Program
Quality Scores Tell More About Patients than Physicians Harvard physicians with poorer/minority patients score low Harvard physicians with poorer/minority patients score low 39% 38% Patient characteristics in panels of high- and low-scoring physicians 29% 26% 17% 14% 10% 10% 3% 0% Minority Non-English Speakers Uninsured or Medicaid Infrequent Visits Top Scoring Physicians Bottom Scoring Physicians Source: Hong C et al. JAMA 9/8/2010. 304:10;1107.
Performance Monitoring Increased Documentation of Alcohol Counseling, But Not Real Counseling Rate 90% 83.0% 68% Alcohol counseling rate among patients screening positive for unhealthy use 70.1% 66.1% 59.4% 45% 23% 0% Documented Patient Reported 2012 2009 Source: JGIM 2017;33:268
CHF and Pneumonia Death Rates Rose with Readmission Penalties Big penalties for readmission; small penalties for mortality 9.54% 8.84% 8.70% Time trend in 30- day post-discharge mortality rate 8.38% 8.23% 8.04% 7.74% 7.67% 7.58% 7.39% 7.11% 7.02% Baseline Pre-Penalty Announced Penalties Announced Penalties in Force Heart Failure Pneumonia Heart Attack JAMA 2018;320:2542
P4P Did Not Lower Hospital Mortality in England P4P Hospitals 20% 30-Day Mortality 15% Control Regions 10% No P4P Bonuses Only Bonuses plus Incentives 5% Difference 2007 2008 2009 2010 2011 2012 Source: N Engl J Med 2014;371:540-548
P4P Did Not Improve Mortality in England World s largest P4P program tied 25% of GP income to quality targets 15. 11.6 11.25 Change in Deaths/100,000 From Pre to Post P4P Implementation 7.5 3.75 0.28 0. -1.75 -2.21 -3.75 Ischemic Heart Disease Cancer Other Non- Incentivized Incentivized Source: Lancet 2016;388:268 Note: Data shows trends compared to developed nations without P4P
VA Hospitals Have Lower Mortality and Readmissions than Other Hospitals Mortality Readmissions 24 22 30 Day Mortality or readmissions per 100 patients 20 18 19 17 17 16 16 16 15 14 12 12 VA Non-VA 9 9 8 8 6 6 0 PNA CHF AMI COPD PNA CHF AMI COPD JAMA IM 2017;177:882 PNA = Pneumonia; All rates are risk-adjusted
VA Hospitals Have Lower Mortality Than Nearby Hospitals A comparison of VA and non-VA hospitals in 121 hospital market areas 30-day mortality rate VA Non-VA 15.8% 13.9% 13.1% 12.5% 11.7% 10.0% 8.4% 4.9% COPD Heart Failure Heart Attack Pneumonia Ann Intern Med 2019;170:426
ACOs and P4P: Implementation Without Evidence P4P Official Medicare policy, widely adopted by private payers Implementing everywhere interventions which have been proven nowhere risks failure on a colossal scale No RCTs showing improved outcomes. No improvement in 3 largest programs. Negative side effects likely, e.g. increased CHF deaths. VA (no P4P) has better quality than hospitals paid P4P ACOs Newest health policy panacea No RCTs. No savings once bonuses factored in. Disturbing HMO experience.