Understanding Inertial Measurement Units (IMUs) in Autonomous Systems
Exploring the fundamentals of IMUs in autonomous systems, covering the basics, inertial navigation, and equations related to tracking position and orientation using accelerometers and gyroscopes. This includes the use of rotation matrices, velocity tracking, and the evolution of rotational velocity in IMUs.

Download Presentation

Please find below an Image/Link to download the presentation.
The content on the website is provided AS IS for your information and personal use only. It may not be sold, licensed, or shared on other websites without obtaining consent from the author. Download presentation by click this link. If you encounter any issues during the download, it is possible that the publisher has removed the file from their server.
E N D
Presentation Transcript
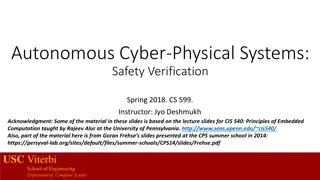
Autonomous Cyber-Physical Systems: Sensing and Perception Fall 2023 CS 513. Instructor: Jyo Deshmukh USC Viterbi School of Engineering Department of Computer Science
Some important sensors for autonomy Inertial Measurement Units Vision-based (Camera) sensors LiDAR Not discussed: GPS RADAR SONAR Audio USC Viterbi 2 School of Engineering Department of Computer Science
Basics of IMUs Inertial Measurement Units or IMUs: part of an Inertial Navigation System Use accelerometers and gyroscopes to track position and orientation of an object relative to start position, orientation and velocity Typically: 3 orthogonal rate-gyroscopes measuring angular velocities, and 3 accelerometers measuring linear accelerations (along the 3 axes) USC Viterbi 3 School of Engineering Department of Computer Science
Inertial navigation USC Viterbi 4 School of Engineering Department of Computer Science
IMU equations Relation between body frame and global frame is given by a 3X3 rotation matrix ?, in which each column is a unit vector along one of the body axes specified in terms of the global axis Rotation matrix is an orthogonal matrix whose determinant is 1. Rotations of ?,?,? about the ?,?, and ? axes respectively achieved by following rotation matrices: 1 0 0 0 0 cos? 0 sin? 0 1 0 sin? 0 cos? cos? sin? sin? cos? ??= ??= cos? sin? 0 sin? cos ? 0 0 0 1 ??= Body Frame vs. Global Frame Image from [1] USC Viterbi 5 School of Engineering Department of Computer Science
IMU equations continued Rotation matrices are orthonormal, i.e., ? 1= ?? Let ?? and ?? be velocities in the global and body frame respectively, then: ??= ??? and ??= ???? We need to track ? through time ? ??? ? = lim ?? 0 ?? Let ? ? be the rotation matrix relating body frame at time ? to body frame at time ? + ??. Then ? ? + ?? = ? ? ?(?). ? ?+?? ? ? If the rotations are small enough, ? ? =? + ? , where ? is the small angle approximation of matrix describing effective rotation in ?? time USC Viterbi 6 School of Engineering Department of Computer Science
IMU equations So, ? ? ?? ??? ? = ? ? lim ?? 0 0 ???(?) 0 ???? ???(?) ???(?) 0 = , Also, lim ???? ???? ?? 0? = where ??? is the rotational velocity along the ?? axis. So ? ? evolves according to the linear dynamical system ? ? = ? 0 exp( 0 In implementation, we can approximate the updated ?(?) at each time step by a numerical integrator Acceleration in the body frame is tracked in a similar fashion. Once we have velocity and acceleration, we can compute position, after subtracting the acceleration due to gravity ? ? = ? ? ? , and the solution for ? ? ??) USC Viterbi 7 School of Engineering Department of Computer Science
Basics of LiDAR LiDAR stands for Light detection and Ranging Typical LiDARs e.g., Velodyne HDL-64E use multi- beam light rays Mathematical model by ray-casting : rays are cast at an angle, and you get the distance from the first obstacle that reflects the light Lidar data consists of rotational angle and distance to obstacle This can be represented in a point cloud form by mapping each obstacle point to (?,?,?) coordinates (with respect to the body frame) USC Viterbi 8 School of Engineering Department of Computer Science
Detection algorithms for video/spatial data Detection of segmented clusters from LIDAR data is done using traditional machine learning algorithms as well as deep learning Detection from images (camera data) Lane line marking detection Drivable path detection Object detection Distances to obstacles Semantic segmentation Scenario identification USC Viterbi 9 School of Engineering Department of Computer Science
Convolutional Neural Networks Inspired by visual cortex in animals Learns image filters that were previously hand-engineered Basic intuitions for CNNs: Images are too large to be monolithically processed by a feedforward neural network (1000x1000 image = 106 inputs, which means the weight matrix for the second layer is proportional to at least 106!) Data in an image is spatially correlated CNN divided into several layers with different purposes USC Viterbi 10 School of Engineering Department of Computer Science
Convolutional layer Receptive field First layer is a convolutional layer Convolutional layer contains neurons associated with sub- regions of the original image Each sub-region is called receptive field Convolves the weights of the convolutional layer with each cell in receptive field to obtain activation map or feature map Image from [1] USC Viterbi 11 School of Engineering Department of Computer Science
Convolution Convolution of a 2-D image I with a 2-D kernel K defined as: ? ?,? = ? ? ?,? = ? ?,? ?(? ?,? ?) ? ? Most neural network libraries do not use convolution, but instead implement cross-correlation, i.e. ? ?,? = ? ? + ?,? + ? ?(?,?) ? ? The kernel function ? usually defines the receptive field USC Viterbi 12 School of Engineering Department of Computer Science
Purpose of convolutional layer Convolutional layer applies a filter to the pixels within its receptive field This allows identifying low-level features (curves, straight lines, etc.) The outputs of the first convolutional layer can be thought of as having a high value when a particular feature is detected and a low value otherwise Second convolutional layer allows learning higher-level features (e.g. semi- circles, angles etc.) Second convolutional layer has a bigger receptive field (as it is able to simultaneously correlate over outputs of first layer) By convolving over the feature map, output of second layer tries to connect higher level features USC Viterbi 13 School of Engineering Department of Computer Science
More insights about convolution Convolution operation basically helps implement three ideas: Sparse interactions (between layers) Parameter sharing Equivariant representations Sparse interaction: By using a kernel function that is smaller than input, not all outputs of the first layer interact with all inputs This reduces the cost of doing matrix multiplication USC Viterbi 14 School of Engineering Department of Computer Science
More insights about convolution Parameter sharing As the kernel function is repeatedly applied to the image, (weight) parameters are shared This reduces storage requirements of the model Equivariant representations Parameter sharing leads to equivariance under translation ? is equivariant to ? if ? ? ? I.e. detected features of a linearly translated image will appear linearly translated = ? ? ? USC Viterbi 15 School of Engineering Department of Computer Science
CNN architecture CNN architecture Number of layers, where each layer contains stages Affine transform/convolution stage performs convolution Detector stage uses a nonlinearity such as a rectified linear unit (ReLU), i.e. max ?,0 Pooling stage performs a suitable pooling operation Next layer Convolutional Layer Pooling stage Detector stage Convolution stage (Affine transform) Input to layer Picture from [2] USC Viterbi 16 School of Engineering Department of Computer Science
Pooling stage Pooling function replaces the output of a layer at a certain location with a summary statistic of the nearby outputs E.g., max pooling reports maximum output within a rectangular neighborhood Other pooling functions include average, L2 norm, weighted average etc. Pooling helps representation be approximately invariant to small translations By pooling over outputs of different convolutions, features can learn which transformations to become invariant to (e.g., rotation etc.) USC Viterbi 17 School of Engineering Department of Computer Science
Fully connected layers CNNs may have some fully connected layers before the final output These layers allows performing higher-level reasoning over different features learned by the previous convolutional layers Various kind of convolution functions, pooling functions and detection functions are possible, giving rise to many different flavors Number of convolutional layers can be varied depending on complexity of features to be learned USC Viterbi 18 School of Engineering Department of Computer Science
R-CNN[3] R-CNN, Fast R-CNN and Faster R-CNN are specific architectures that help with object detection Objective is to obtain from an image: A list of bounding boxes A label assigned to each bounding box A probability for each label and bounding box The key idea in R-CNNs is to use region proposals and region of interest pooling USC Viterbi 19 School of Engineering Department of Computer Science
R-CNN, Fast-RCNN, Faster-RCNN R-CNN Scan image for possible objects (using selective search) Generating region proposals (bounding boxes where possible objects may lie) Run a CNN on region proposals Take output of each CNN and feed it to an SVM to classify the region Fast-RCNN Replace SVM with a softmax layer Faster-RCNN Replaces slow selective search algorithm with a fast neural net USC Viterbi 20 School of Engineering Department of Computer Science
YOLO algorithm (You Only Look Once) YOLO is one of the fastest real-time detection algorithms (See [4,5,6]) R-CNN etc. are algorithms that leverage classifiers and localizers to perform detection YOLO applies a single neural network to the entire image Network divides image into regions and predicts bounding boxes and probabilities for each region Bounding boxes are weighted by predicted probabilities USC Viterbi 21 School of Engineering Department of Computer Science
Localization Most common approach is to use odometry + GPS + Kalman filter This becomes unreliable in urban environments, tunnels, tall buildings etc. where GPS signal quality is poor Map-aided localization: Use local features to achieve precise localization SLAM (simultaneous localization and mapping): most popular approach USC Viterbi 22 School of Engineering Department of Computer Science
Main steps in SLAM ACPS moves reaching a new point of view of its location Motion model captures car motion, but could be inaccurate because of actuation errors ACPS discovers interesting features in the environment that need to be incorporated into the map Features are called landmarks; because of sensor errors, positions of landmarks will be uncertain. Mathematical model to determine position of landmarks from observation is called inverse observation model USC Viterbi 23 School of Engineering Department of Computer Science
Main steps in SLAM (continued) ACPS observes previously mapped landmarks and uses them to correct its self-localization and positions of landmarks in the map Localization and landmark uncertainties decrease Predict values of measurement from predicted landmark location and robot localization is called direct observation model SLAM = above three models + an estimator (EKF is common) SLAM viewed as a Bayesian filtering problem USC Viterbi 24 School of Engineering Department of Computer Science
Sensor Fusion We already learned about Kalman filter that can help do sensor fusion for localization using INS and GPU Sensor fusion for camera and LiDAR data requires new algorithms Centralized algorithms based on conditional random fields, Markov random fields, and decentralized algorithms based on boosting and Gaussian mixture models have been explored Deep learning is also being explored for doing sensor fusion Note: these approaches are exploratory, and there is no standard algorithm accepted by all USC Viterbi 25 School of Engineering Department of Computer Science
References [1] Understanding CNNs: https://adeshpande3.github.io/A-Beginner%27s-Guide-To-Understanding- Convolutional-Neural-Networks/ [2] I. Goodfellow, Y. Bengio, A. Courville, Deep Learning, MIT Press. [3] https://towardsdatascience.com/deep-learning-for-object-detection-a-comprehensive-review- 73930816d8d9 [4] https://towardsdatascience.com/yolo-you-only-look-once-real-time-object-detection-explained- 492dc9230006 [5] https://pjreddie.com/darknet/yolo/ [6] YOLO algorithm: https://arxiv.org/abs/1506.02640 USC Viterbi 26 School of Engineering Department of Computer Science
Bibliography O. J. Woodman, An introduction to inertial navigation - Cambridge Computer Laboratory, https://www.cl.cam.ac.uk/techreports/UCAM-CL-TR-696.pdf 1. Pendleton, Scott Drew, Hans Andersen, Xinxin Du, Xiaotong Shen, Malika Meghjani, You Hong Eng, Daniela Rus, and Marcelo H. Ang. "Perception, planning, control, and coordination for autonomous vehicles." Machines 5, no. 1 (2017): 6. 2. S. Liu, L. Li, J. Tang, S. Wu, Jean-Luc Gaudiot, Creating Autonomous Vehicle Systems, Morgan & Claypool 2018. 3. USC Viterbi 27 School of Engineering Department of Computer Science
Bibliography Pendleton, Scott Drew, Hans Andersen, Xinxin Du, Xiaotong Shen, Malika Meghjani, You Hong Eng, Daniela Rus, and Marcelo H. Ang. "Perception, planning, control, and coordination for autonomous vehicles." Machines 5, no. 1 (2017): 6. 1. Good introduction to Hough transform and various vision algorithms: http://aishack.in/tutorials/hough- transform-normal/ 2. Hough transform basics: http://web.ipac.caltech.edu/staff/fmasci/home/astro_refs/HoughTrans_review.pdf 3. Graph-based clustering: http://vision.stanford.edu/teaching/cs231b_spring1213/slides/segmentation.pdf 4. MRF/CRF fundamentals https://www.cs.umd.edu/~djacobs/CMSC828seg/MRFCRF.pdf 5. Edge detection: https://www.swarthmore.edu/NatSci/mzucker1/e27_s2016/filter-slides.pdf 6. SLAM: https://people.eecs.berkeley.edu/~pabbeel/cs287-fa09/readings/Durrant-Whyte_Bailey_SLAM- tutorial-I.pdf 7. USC Viterbi 28 School of Engineering Department of Computer Science


")


")