Understanding Paper Chromatography: Ink Analysis & More
Explore the fascinating world of paper chromatography, a technique used to separate and analyze different pigments in ink. Learn how water and capillary action help reveal hidden colors in black ink, and discover the science behind chromatography terminology. Try a hands-on activity to conduct a color chromatography experiment using common materials. Unveil the magic of chromatography and unravel the secrets of ink composition!

Download Presentation

Please find below an Image/Link to download the presentation.
The content on the website is provided AS IS for your information and personal use only. It may not be sold, licensed, or shared on other websites without obtaining consent from the author. Download presentation by click this link. If you encounter any issues during the download, it is possible that the publisher has removed the file from their server.
E N D
Presentation Transcript
Paper Chromatography Ink Analysis
Paper Chromatography The word chromatography comes from the Greek words chroma and graph for color writing . Commonly used in crime scenes or laboratories to identify an unknown compound by comparing it to known compounds. We can use this technique to separate pigments in a marker based on the physical properties of each pigment (solubility and adsorption). Image from Royal Society of Chemistry
Separation Anxiety- Science Snack Activity Use water to learn about black magic markers. By using color chromatography a technique that uses capillary action to separate different types of ink at different rates you can discover the secret colors hidden in black ink. For the full science snack go to https://www.exploratorium.edu/snacks/separation-anxiety Exploratorium
Whats Happening? Water travels up the paper due to a phenomenon called capillary action. The water dissolves the dried ink pigments and carries them along. Different colored pigments are carried at different rates - some travel farther than others. The rate each pigment travels depends on: How strongly it s attracted to water (solubility) Pigments strongly attracted to water (high solubility) will travel further/faster with the water How strongly it s attracted to the paper (adsorption) Pigments strongly attracted to the paper (strong adsorption) will move more slowly and be more likely to stay behind with the paper. Image from Royal Society of Chemistry
Talk Like A Scientist: Terminology Solution: A mixture in which a minor component (solute) is uniformly distributed within the major component (solvent) Solvent: Substance that dissolves the solute particles during the formation of a solution. Usually a liquid, but doesn t have to be. Solute: A solute is a substance that is added to a solvent to form a solution. Image from: The Chemistry Notes
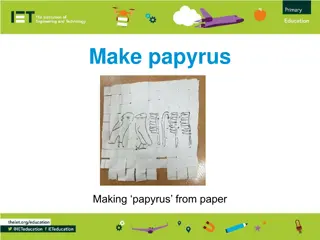
You Try It! practice trial) (use a color other than black for a 1. Cut coffee filter into strips about 3 cm wide and 10 cm long. a. You will want one strip per marker 2. Draw a line across the width of the strip with a pencil. a. About 1 inch up from the bottom of the strip, running parallel to the paper s bottom edge, with a small gap between the line and the edges. b. The pencil line will indicate the starting position of the sample. 3. 4. Draw a dark line with your marker covering the pencil line. Tape the marked filter paper strip to the coffee stirrer. Balance the coffee stirrer on the rim of the cup, with the filter paper dangling in the middle of the cup. Put enough water in the cup that the bottom of the filter touches the 5. water, but the line is not submerged in water. 6. Let the water run up the strip for approximately 20 minutes. Exploratorium
Data Collection: Retention Factor (Rf) We can quantify and compare the distance each dye color has traveled in our samples by calculating the Rf (Retention factor) of each pigment. 1. Measure the distance from the pencil line (starting point) to the furthest point the water traveled (solvent front). 2. Measure distance a specific dye color traveled from the starting point. 3. Divide the distance the specific dye traveled by the distance the solvent (water) traveled to obtain the Rf value for that dye in your sample. 4. Repeat this measurement and calculation for each dye color for each sample. Image from: MIT SWE
Exit Ticket 1. Calculate the Rf values for each pigment, in each sample, on your data collection worksheet. 1. Which marker was used to write the ransom note? 1. Based on your results, who do you think committed the crime? Why? 1. Did any of the markers have the same chromatography results? Which ones? 1. What do you think are some limitations of this method?


")