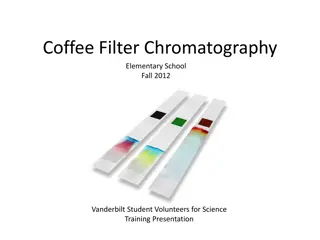
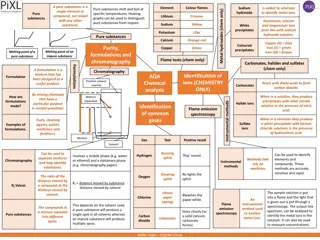
Understanding Chromatography: Techniques and Applications
Chromatography, discovered by Russian botanist Tsvett, has diverse applications like identifying compounds, monitoring reactions, and optimizing solvents. Stationary phases such as silica and alumina, along with mobile phases like ethanol and acetone, play crucial roles in separation based on polarity. This technique is vital in fields like chemistry and biology for separating mixtures and analyzing substances with high precision.

Download Presentation

Please find below an Image/Link to download the presentation.
The content on the website is provided AS IS for your information and personal use only. It may not be sold, licensed, or shared on other websites without obtaining consent from the author. Download presentation by click this link. If you encounter any issues during the download, it is possible that the publisher has removed the file from their server.
E N D
Presentation Transcript
Lecture 6a yer Chroma
Introduction I Chromatography was discovered by Russian botanist Mikhail Semyonovich Tsvett, who separated plant pigments using calcium carbonate columns (1901). Martin and Synge (Noble Prize in Chemistry, 1952) established many of the basic techniques in partition chromatography i.e., paper chromatography, gas chromatography, HPLC, etc.
Applications I TLC is usually performed on a glass, plastic or aluminum foil that is covered with an adsorbent (=stationary phase). Uses Identify compounds in a mixture by comparison with internal standards. Determine the purity of a compound. Monitor the progress of reactions to determine its completion. Optimizing a solvent mixture (mobile phase) for column chromatography. The compound in the mixture separate sufficiently well on the TLC plate. It is important to use the same stationary phase (ideally same quality) as used in the chromatography later on.
Applications II Separation of dyes in pen ink (i.e., black ink): As can be seen, the black ink is actually a mixture of different dyes. Separation and determination of pigments in plants (i.e., spinach): The TLC shows different compound such as carotene, lypocene, chlorophylls, xanthophylls, pheophytins, etc. Monitor the progress of fermentation in wine making (T=tartaric acid, M=malic acid, L=lactic acid).
Stationary Phase Commonly used are silica, alumina, cellulose (i.e., paper chromatography), etc. O Al Al http://upload.wikimedia.org/wikipedia/commons/thumb/0/07/Cellulose_Sessel.svg/260px-Cellulose_Sessel.svg.png O O Al Al Al O O O Al Al These stationary phases are considered polar due the presence of hydroxyl groups on the surface and their ability to form hydrogen bonds with polar and protic solvents. Silica-coated TLC plates are primarily used in organic labs because most of the compounds analyzed in the lab are (weakly) polar due to the presence of carbonyl groups, hydroxyl functions, etc. The type of stationary phase used in a given separation problem depends on the polarity of compounds and the separation mechanism.
Mobile Phase The eluting power of the mobile phase depends on the polarity of the solvent vs. the polarity of the stationary phase: Water Methanol Ethanol Propanol Acetone Ethyl acetate Diethyl ether Chloroform Methylene Chloride Toluene Hexane if polar stationary phase then increasing eluting power if nonpolar stationary phase then increasing eluting power Polar solvents i.e., alcohols have a high eluting power on polar stationary phases because they interact strongly with the polar stationary phase via their hydrogen bonding donor and a hydrogen bond acceptor ability. Medium-polar solvents like ketones, esters and ethers possess a medium eluting power because they only act as hydrogen bond acceptors. Non-polar solvents i.e., toluene, hexane, etc. have a low eluting power on polar stationary phases because their interaction with polar stationary phase is weak. The general affinity of functional groups towards silica is: ionic > acids/bases > amides > alcohols > ketones > aldehydes > esters > ethers > halides > unsaturated hydrocarbons > saturated hydrocarbons
Experimental I TLC Plate The plate is coated with a very thin layer (~0.25 mm) of a mixture of a stationary phase and a binder i.e., gypsum. The stationary phase often also contains a fluorescent indicator (zinc silicate, zinc cadmium sulfide), which appears bright green when exposed to short wavelengths ( =254 nm). Preparation of the TLC plate The white surface should not be touched. Draw a very thin start line with pencil or mark the plate on the lower end on each side (~0.5 cm from the bottom). Do not use a pen for this step.
Experimental II Spotting A capillary spotter (drawn from a Pasteur pipette) or a commercial spotter should be used for spotting (top: melting point capillary, bottom: commercial spotter). Melting point capillaries, syringe needles, etc. (as is) are not suitable for the spotting process because they produce a huge spot that overloads the plate (=tailing, see also last slide)! The spots have to be equally spread at the starting line and not be located too close to the outer edges. The spots have to be small in diameter (~1-2 mm). A diluted solution of the compound in a low-boiling, low polarity solvent i.e., diethyl ether, hexane, ethyl acetate, etc. has to be used (5 mg/mL). If the compound cannot be detected with the naked eye, the TLC plate has to be dried and then be inspected under the UV-lamp prior to development i.e., benzil, dibenzyl ketone are colorless in low concentrations.
Experimental III Developing the Plate A jar or a small beaker covered with a watch glass is used as development chamber, lining the walls with wet filter paper is usually not necessary if the jar is kept close. The solvent level in the jar has to be below the starting line. The TLC plate is placed straight in the chamber, which is left undisturbed. The compounds move up the plate at different rates (if the proper mobile phase is used). Brown: Mixture Green: compound A Red: compound B t=0 min t=1 min t=5 min Note that the rate of movement is not constant (Why?). The solvent front is allowed to move up the plate until ~1 cm from the top. The plate is then removed and the solvent front immediately marked.
Experimental IV Visualization (for more reagents see SKR 326): First, the plate has to be dried thoroughly. UV light: It is only useful if the compounds are UV active and the stationary phase contains a fluorescent indicator. Iodine: It is used for unsaturated and aromatic compounds (brown stain, not permanent). Permangante: It is used for compounds that can be oxidized easily (mostly yellow on purple). Vanillin: It works well for hydroxyl and carbonyl compounds (appear in different colors depending on the compound). Ceric staining (CAM): It is good general stain but particularly sensitive for hydroxyl, carbonyl, epoxides (dark blue upon heating). Ninhydrin: It is used for amino acids, amines (often pink or purple). Bromocresol green: It is mainly used to detect carboxylic acids. After marking the spots with pencil, the diagram is transferred to the notebook (taking a picture with the cell phone could not hurt either). Do not take the TLC plate home because the silica will rub off. Silica powder can cause a lung disease called silicosis.
Data Analysis Determination of Rf-value: Measure the distance of the center of the spot from the starting line (g, r). Measure the distance of the solvent front from the starting line (s). The Rf-value is defined as the ratio of the travel distances. s r g r = = R ( red ) . 0 65 f s g = = R ( green ) . 0 34 f s The Rf-value is a ratio and thus is a unitless number. The Rf-value has to be between 0 and 1 .
Solvent Effect Changes in the mobile phase have an impact on the movement of all compounds (with varying degree though due to changes in various parameters): A B P A B P Hexane e0=0.0 Chloroform e0=0.26 Diethyl ether e0=0.38 The more eluting power the mobile phase (given as e0-values on silica above) has, the more the compounds move because the mobile phase interacts stronger with the stationary phase. This makes it more difficult for the compounds to interact with the stationary phase leading to higher Rf-values and (often) poorer separation.
Common Problems Problem 1: All spots are grouped together on the lower (upper) end of the plate. Solution 1: The eluting power of the solvent was too low (high) for this separation problem. A more polar (less polar) solvent should be added to the mobile phase (see previous slide). Problem 2: The spot is spread over a large part of the lane or does not look round. Solution 2: The student spotted too much of the sample on the plate that leads to tailing. Less sample should be spotted using the proper spotter. Problem 3: The spot has a crescent shape after the development. Solution 3: The solvent used to dissolve the sample was too polar and was not allowed to evaporate completely. Problem 4: The spots seem to run into each other on the top. Solution 4: Either the spots were to close at the start line or the TLC plate was not placed straight in the jar.