Overview of Vegetation Index EDR Data Products and Team Members
This content discusses the JPSS STAR Algorithm and Data Products (ADP) Beta Review related to Vegetation Index EDR, including details on various data products, team members, beta maturity definition, and background of VI EDR product. It provides insights into the TOA-NDVI and TOC-EVI vegetation indices, their significance in environmental monitoring, and the role of VI in global climate modeling and remote sensing applications.
Download Presentation

Please find below an Image/Link to download the presentation.
The content on the website is provided AS IS for your information and personal use only. It may not be sold, licensed, or shared on other websites without obtaining consent from the author. Download presentation by click this link. If you encounter any issues during the download, it is possible that the publisher has removed the file from their server.
E N D
Presentation Transcript
JPSS STAR Algorithm and Data Products (ADP) Beta Review Suomi NPP Vegetation Index EDR Marco Vargas VI-EDR Algorithm Lead Tomoaki Miura VI-EDR Cal/Val Lead 12/19/2012
Overview of VI EDR Data Products SNPP VIIRS TOC EVI 16-day composite 2
Overview of VI EDR Data Products SNPP VIIRS TOA NDVI 7-day composite 3
Vegetation Index EDR Team Members Marco Vargas (NOAA/NESDIS/STAR) STAR VI EDR algorithm lead Tomoaki Miura (University of Hawaii) VI Cal/Val lead Nikolay Shabanov (STAR/IMSG) Product monitoring and validation, algorithm development Alfredo Huete (UTS) Cal/Val Team Member Leslie Belsma (Aerospace) Land JAM Alain Sei (NGAS) External Partner, Consultant Michael Ek (NOAA/NCEP) User readiness RGB Image shows dense smoke (high absorption) in northwest, north central and central coastal portions of image. Ivan Csiszar (NOAA/NESDIS/STAR) STAR Land EDRs Chair Jesse Meng (NOAA/NCEP) User readiness Jeff Privette (NOAA/NESDIS/NCDC) Product validation lead, Land EDRs Co-Chair 4
Beta Maturity Definition Early release product Minimally validated May still contain significant errors Versioning not established until a baseline is determined Available to allow users to gain familiarity with data formats and parameters Product is not appropriate as the basis for quantitative scientific publications, studies or applications 5
Background of VI EDR Product VI EDR consists of two vegetation indices: the TOA Normalized Difference Vegetation Index (TOA-NDVI) and the TOC Enhanced Vegetation Index (TOC-EVI). VI EDR provides continuity with NASA EOS MODIS and NOAA POES AVHRR. TOA - NDVI:Top of the Atmosphere Normalized difference vegetation index is most directly related to absorption of photosynthetically active radiation, but is often correlated with biomass or primary productivity. TOC EVI: Top of the Canopy Enhanced Vegetation Index EVI was developed to optimize the vegetation signal with improved sensitivity in high biomass regions and improved vegetation monitoring through a reduction in atmosphere influences. Vegetation Index (VI) is one key parameter to specify the boundary condition in global climate models, weather forecasting models and numerous remote sensing applications for monitoring environmental state and its change. 6
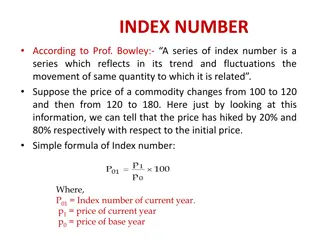
VIIRS Vegetation Index EDR Product Description: Provides the Normalized Difference Vegetation Index (NDVI) and the Enhanced Vegetation Index (EVI) at 375 m on a daily basis. NDVI =(rI2 TOA-rI1 TOA)/(rI2 TOA+rI1 TOA) Retrieval Strategy: The NDVI derived from TOA reflectance: The EVI derived from TOC reflectance with a different gain factor from that of the MODIS equation: rI2 TOC-rI1 TOC-C2 rM3 TOC EVI =(1+L) rI2 TOC+C1 rI1 TOC+L Product Layers: Includes quality flags on Land/water Cloud confidence including thin cirrus Heavy aerosol loadings Exclusion conditions TOA NDVI TOC EVI VIIRS VI EDR Oct. 1, 2012 (Mx 6.3)
Overview of Vegetation Index EDR TOA NDVI will provide continuity with the AVHRR heritage product TOC EVI will provide continuity with the MODIS heritage product These indices are produced at the VIIRS image channel resolution (i.e. nominally 375m at nadir). VI EDR uses Spectral bands I1, I2 and M3 The VIIRS Vegetation Index EDR is computed after the RDR, SDR, and intermediate products processing is complete. Product style: Swath File Format: HDF5 Measurement Exclusion Conditions: 1) SZA > 85 deg for both NDVI and EVI (NIGHT TIME) 2) AOT > 1.0 for EVI 3) Confidently cloudy Retrievals are not performed over ocean or coastal VI calculated for LAND retrievals including inland water bodies and rivers. Assumption for EDR validation is that the VIIRS SDR is calibrated. Beta versions of SDR have been used to help algorithm and instrument assessments during EOC and the early stages of ICV. 8
L1RD Requirements Source: Level 1 Requirements SUPPLEMENT Final Version 2.3 November 2, 2012 9
Users of Vegetation Index EDR Products (Point Of Contact) NCEP- National Centers for Environmental Prediction (Michael Ek/Jesse Meng/Yihua Wu/Matthew Rosencrans) STAR - Center for Satellite Applications and Research (Felix Kogan) CLASS - Comprehensive Large Array-data Stewardship System (John Bates) USDA - United States Department of Agriculture (Eric Luebehusen) The Climate Corporation Pavel Machalek USGS - U.S. Geological Survey UH - University of Hawaii UA - University of Arizona UTS - University of Technology Sydney 10
Vegetation Index EDR Dataflow The VIIRS Vegetation Index EDR requires: calibrated TOA reflectances (bands I1, I2), SDR auxiliary data (solar zenith angle) Surface Reflectance (bands I1, I2, M3, Land Quality Flags). VI coefficients Figure 2. Data Flow Diagram of Overall VVI EDR Call Sequence from the Main Program (OAD VIIRS VI EDR 474- 00063 January 18, 2012). Figure 1. Processing chain associated with VIIRS Vegetation Index EDR (OAD VIIRS VI EDR 474-00063 January 18, 2012). 11
History of Algorithm changes/updates DR# Reason Status Erroneous quality flag for missing input data VI-EDR team is preparing an enhanced set of QFs to improve the VI product quality. We expect to close this DR before provisional release (Sept 2013) DR 4622 EVI requirements in L1RD in error Open DR 4380 L1RD drops wavelengths, needs to be defined We expect to close this DR before provisional release (Sept 2013) DR 4379 Baseline of ephemeral tuning coefficients We expect to close this DR before provisional release (Sept 2013) DR 4377 Vegetation Index: L1RD requires NDVI TOC Open DR 4376 Thin Cirrus Correction and Flagging Approved for Future Re-evaluation DR 4297 EVI Quality should degrade AOT>1 QF update in preparation, we expect to close this DR before provisional release (Sept 2013) DR 4290 Byte 0 Quality Flag Structure Closed DR 3375 Erroneous thin cirrus test in vegetation index Closed DR 2887 12
Beta Maturity Evaluation Internal performance evaluation Assessment of data structure and integrity Quality assessment at granule level Quality assessment using regional/global mosaics Visual assessment of quality flags External performance evaluation Comparison with Aqua MODIS (and AVHRR) using regional/global mosaics Assessment of time series using Aqua MODIS (and AVHRR) as a reference 13
Beta Maturity Evaluation Many fill-valued pixels found over bright targets only for TOC-EVI Fill-valued M3 surface reflectance, likely due to the overestimation of AOT QFs of SR IP indicating: Poor M3 SDR (NA_FLOAT32_FILL: -999.9), or ERR_FLOAT32_FILL (-999.5) TOC-EVI TOA-NDVI VIIRS EDR over Sahara 2012-055 (Mx 5.2)
Beta Maturity Evaluation Erroneous EVI values over snow/ice covered surface EVI values become unrealistically high or low. VIIRS False Color Composite and VI EDR Greenland, 2012-219 (Mx 5.3) SR IP False Color RGB: I1, I2, M3 TOA-NDVI TOC-EVI 15 -0.3 0.0 0.5 1.0
Beta Maturity Evaluation Erroneous EVI values over residual clouds EVI values become unrealistically high or low. Ukraine, 2012-219, VIIRS False Color Composite and VI EDR (Mx 5.3) SR IP False Color RGB: I1,I2,M3 TOA-NDVI TOC-EVI 16 -0.3 0.0 0.5 1.0
Beta Maturity Evaluation Regional mosaic comparisons with Aqua MODIS Near-simultaneous nadir observations Overlapped orbital tracks with view zenith angles < 10degrees Every 8 days Solar zenith angle differences of 1-2 degrees Screened by quality flags Only using MODIS QA at this point Orbital Tracks with v< 10o for 2012-211 (July 29) Blue: NPP VIIRS Red: Aqua MODIS 17
Beta Maturity Evaluation TOA-NDVI TOC-EVI APU Summary Tables * APU metrics of VIIRS VI EDR (in reference to Aqua MODIS) consistent over time. 0.06 0.12 2012-147 2012-147 2012-147 0.10 0.04 0.08 Statistical Differences Statistical Differences TOA-NDVI TOC-EVI 0.06 (in NDVI unit) 0.02 0.04 (in EVI unit) 0.02 A 0.005 -0.04 0.00 0.00 -0.02 P 0.007 0.005 -0.02 -0.04 Accuracy Precision Uncertainty -0.06 -0.04 -0.08 U 0.012 0.05 -0.10 -0.06 -0.12 0.0 0.2 0.4 0.6 0.8 1.0 0.0 0.2 0.4 0.6 0.8 VIIRS TOA-NDVI VIIRS TOC-EVI 0.06 0.12 2012-211 2012-211 2012-211 0.10 0.04 0.08 Statistical Differences Statistical Differences TOA-NDVI TOC-EVI 0.06 (in NDVI unit) 0.02 0.04 (in EVI unit) 0.02 A 0.005 -0.05 0.00 0.00 -0.02 P 0.007 0.006 -0.02 -0.04 Accuracy Precision Uncertainty -0.06 -0.04 -0.08 U 0.014 0.06 -0.10 -0.06 -0.12 0.0 0.2 0.4 0.6 0.8 1.0 0.0 0.2 0.4 0.6 0.8 VIIRS TOA-NDVI VIIRS TOC-EVI 0.06 0.12 2012-243 2012-243 2012-243 0.10 0.04 0.08 Statistical Differences Statistical Differences TOA-NDVI TOC-EVI 0.06 (in NDVI unit) 0.02 0.04 (in EVI unit) 0.02 A 0.005 -0.05 0.00 0.00 -0.02 P 0.007 0.006 -0.02 -0.04 Accuracy Precision Uncertainty -0.06 -0.04 -0.08 U 0.012 0.06 -0.10 -0.06 -0.12 0.0 0.2 0.4 0.6 0.8 1.0 0.0 0.2 0.4 0.6 0.8 VIIRS TOA-NDVI VIIRS TOC-EVI
Beta Maturity Evaluation VIIRS VI temporal profiles (3 km-by-3 km window) depicting seasonal changes comparable to those of Aqua MODIS TOA-NDVI TOC-EVI
Beta Maturity Evaluation Good/intact data structure and integrity: Residual clouds Missing EVI values over bright surfaces Erroneous EVI values over snow/ice and residual clouds Regional mosaic comparisons: Dates examined: 2012-055, 107-251 (every 8 day), & 307. Consistent over time Bias similar to those predicted from pre-launch validation results (Hyperion spectral synthesis analysis) Time series: Land cover types examined: broadleaf forest, woodland, shrubland, grassland, cropland, urban All seasonal trends comparable to those of MODIS although subject to more unsystematic noises (variations) 20
VIIRS VI product Quality Control tool at STAR Web-based tool was implemented at STAR for continuous (NRT in the future) monitoring of performance of VIIRS VI product time series at global scale (especially important at the early stage of VIIRS mission to detect/trace anomalies, trends and conformity to physically principles). VIIRS VI product is compared with heritage MODIS and AVHRR VI products. Analysis includes daily and compositing VI and QC maps, maps of VI difference (VIIRS- MODIS, VIIRS- AVHRR), histograms and time series of statistics at biome-by-biome level and globally. http://www.star.nesdis.noaa.gov/smcd/viirs_vi/Monitor.htm 21
Beta Maturity Evaluation MODIS LAI/FPAR 6-biome Land Cover Data sets analyzed Global VIIRS, MODIS and AVHRR VI products from March to July 2012. VIIRS daily and compositing VI products corresponding to MODIS and AVHRR data sets. MODIS vegetation index TOC-EVI 16- day composites NOAA-18 AVHRR TOA-NDVI 7day composites. MODIS Land cover LAI/FPAR 6-biomes land cover, annual product, ancillary data set, allowing biome- level analysis 22
MODIS vs. Suomi NPP VIIRS Enhanced Vegetation Index (EVI) Analysis of daily VIIRS TOC-EVI (VIIRS: July 18, 2012, vs. MODIS: July 11 July 26, 2012) Overall, spatial patterns and histograms of VIIRS and MODIS TOC EVI are consistent However, VIIRS TOC EVI exhibits anomalously high values over snow-covered areas at high SZA (i.e., Greenland) Also cloud leakage is pronounced at Northern latitudes (patterns of unusually low VI or negative difference). Those also can bee seen in histograms, as increased weight at low VI values. VIIRS MODIS Difference VIIRS minus MODIS 23
MODIS vs. Suomi NPP VIIRS Enhanced Vegetation Index (EVI) Analysis of 16-day compositing VIIRS TOC-EVI (VIIRS and MODIS for: July 11 July 26, 2012) 16-day Compositing removes gaps associated with cloudy pixels Compositing also removes low VI values (due to cloud under screening). However, simplified compositing implemented (selection of closest to nadir observations) is not up to MODIS accuracy, due to current limitations of VIIRS QC (i.e., lack of aerosol contamination level) VIIRS MODIS Difference VIIRS minus MODIS 24
MODIS vs. Suomi NPP VIIRS Enhanced Vegetation Index (EVI) Time Series of VIIRS-MODIS TOC EVI Daily VIIRS TOC EVI systematically underestimates compositing MODIS TOC EVI at the global scale. This is due to cloud leakage in VIIRS Cloud Mask. This is especially noticeable over Needle leaf forest (Northern high latitudes) This discrepancy has an increasing trend from Spring to Summer probably due to natural seasonality of cloud coverage Compositing virtually removes systematic bias between VIIRS and MODIS TOC EVI, and decreases STD, especially for Needle leaf forests. 25
AVHRR vs. Suomi NPP VIIRS Normalized Difference Vegetation Index (NDVI) Analysis of daily VIIRS TOA-NDVI (VIIRS: July 15, 2012, vs. NOAA-18 AVHRR: July 15 July 21, 2012) Overall, spatial patterns and histograms of VIIRS and AVHRR TOA NDVI are consistent VIIRS NDVI is higher than AVHRR NDVI especially at the Southern hemisphere (this is probably a radiometric effect arising due to large differences in sensor bandwidths) However, at the Northern hemisphere cloud leakage in VIIRS data dominates and VIIRS TOA NDVI is lower than AVHRR 7- day NDVI. Cloud leakage exhibits well-pronounced signatures in the histograms VIIRS AVHRR Difference VIIRS minus AVHRR 26
AVHRR vs. Suomi NPP VIIRS Normalized Difference Vegetation Index (NDVI) Analysis of 7-day compositing VIIRS TOA-EVI (VIIRS and NOAA-18 AVHRR for: July 15 July 21, 2012) 7-day Compositing removes gaps and cloud leakage. However, due to short time interval and simplified compositing, residual cloud leakage may persist at some areas at the Northern latitudes (map of difference) After compositing it becomes clear that AVHRR data are systematically lower all over the globe). This systematic bias is seen over global and biome-by-biome histograms. VIIRS AVHRR Difference VIIRS minus AVHRR 27
AVHRR vs. Suomi NPP VIIRS Normalized Difference Vegetation Index (NDVI) Time Series of VIIRS- NOAA-18 TOA NDVI Daily VIIRS TOA NDVI systematically overestimates compositing AVHRR TOA NDVI at global scale. This is due to cloud leakage in VIIRS Cloud Mask. However, this discrepancy decreases from Spring to Summer due to counter-balancing effect of increasing cloud leakage. Compositing removes effect of cloud leakage and make clear systematic bias between VIIRS and AVHRR TOA NDVI. 28
Summary of VIIRS VI Performance at Global Scale VIIRS VI data TOA NDVI TOC EVI Reference NOAA-18 AVHRR MODIS Mean (VIIRS-Reference) +0.05 -0.05 STD (VIIRS-Reference) 0.25 0.20 1) Trend of increasing negative anomalies over Northern high latitudes from Spring to Summer. This is under- screening of atmospheric impact and can be reduced by compositing. 2) However, aside from cloud impact, TOA NDVI from VIIRS is higher compared to that from AVHRR. This can be seen even in the daily VIIRS data affected by clouds. Most probable reason for overestimation is an impact of sensors bandwidth differences. 1)Trend of increasing negative anomalies over Northern high latitudes from Spring to Summer. This is an effect of cloud leakage which can be eliminated by compositing. 2)Large positive TOC EVI anomalies are observed over Northern high latitudes (Greenland and Siberia during winter). This is due to retrievals under snow at high SZA. Anomalies can be screened away by tracing data with negative denominator in the equation of TOC EVI. Detected anomalies 29
Beta Maturity Evaluation Consistency of global spatial patterns between VIIRS-VI and heritage VI (AVHRR TOA-NDVI and MODIS TOC EVI) Time series of global VI EDR generally match heritage VI However, daily VIIRS TOC EVI data are (1) substantially affected by residual clouds and (2) anomalously high values at snow covered areas are present at Northern high latitudes. Compositing of VIIRS TOC EVI removes atmospheric effect and makes VIIRS TOC EVI highly consistent with MODIS Daily VIIRS TOA NDVI are also affected by residual clouds in the same way as TOC EVI. However, after compositing, VIIRS data are systematically higher than AVHRR data 30
Beta Considerations/Remaining Issues Enhancements to be proposed/examined for the VI EDR 1) Adding TOC-NDVI 2) Updating/revising QA fields (same as MODIS) 3) Refining the EVI algorithm A backup algorithm over snow/ice covered areas Coefficient adjustment or an EVI2 algorithm 4) Temporal compositing 5) EVI equation revision: the gain factor VIIRS MODIS rNIR-rred rNIR-rred EVI =G EVI =(1+L) rNIR+C1rred-C2rblue+L rNIR+C1rred-C2rblue+L 31
Future Plan Near-term Algorithm refinement Evaluate Top Of Canopy (TOC) NDVI produced from Surface Reflectance IP ASRVN, Tower Reflectance, FLUXNET: obtain initial APU estimates before provisional release; continue the analysis to increase a number of sites with longer time series Mid-to-long term Full evaluation of updated science algorithm and code Provisional release of VI EDR by September 2013 Validated Version 1 status by July 2014
Summary of Findings Initial results show that the VIIRS Vegetation Index EDR product is performing well. No obvious problems present at this time, including data structure Retrievals expected to improve significantly with improvements in upstream processing. VI EDR has met the beta stage based on the definitions and the evidence shown Exceeding the definition of beta in most cases 33


