Understanding Quantitative Genetics of Disease - Part 2
This content delves into the quantitative genetics of disease, exploring concepts like liability threshold models, phenotypic liabilities, normality assumptions, and genetic factors' contribution to disease variance. It examines how disease prevalence and heritability correlate with affected individuals' relatives and the underlying normality assumptions in genetic studies.

Download Presentation

Please find below an Image/Link to download the presentation.
The content on the website is provided AS IS for your information and personal use only. It may not be sold, licensed, or shared on other websites without obtaining consent from the author. Download presentation by click this link. If you encounter any issues during the download, it is possible that the publisher has removed the file from their server.
E N D
Presentation Transcript
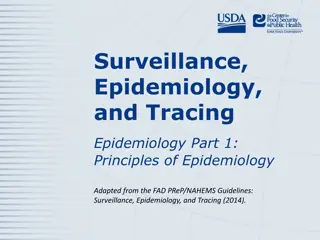
STAT3306/7306 Quantitative Genetics of Disease Pt2 Loic Yengo (slides Prof. Wray) imb Institute for molecular bioscience 1
Aim of this lecture In this lecture, we will show why these statements are consistent : If a disease affects 1% of the population and has heritability 80% then If an individual is affected ~8% of his/her siblings affected If an MZ twin is affected ~50% of their co-twins are affected 2
Liability threshold model Phenotypic liability of a sample from the population Proportion K affected Assumption of normality - Only appropriate for multifactorial disease - i.e. more than a few genes but doesn t have to be highly polygenic - Key unimodal 3
Does an underlying normality assumption make sense? Assumes approximately normal distribution of liability Makes sense for many genetic variants and environmental/noise factors 1 Locus 3 Genotypes 3 Classes 2 Locus 9 Genotypes 5 Classes 3 Locus 27 Genotypes 7 Classes 4 Locus 81 Genotypes 9 Classes 3 3 7 20 6 15 5 2 2 4 10 3 1 1 2 5 1 0 0 0 0 Each Locus has alleles R and r, R = risk alleles. Each class has a different count of number of risk alleles
Falconer (1965) Phenotypic liability of a sample from the population Proportion K affected Relationship of relatives to affected individuals aR Phenotypic liability of relatives of affected individuals Proportion KR affected Using normal distribution theory what percentage of the variance in liability is attributale to genetic factors given K, KR and aR 5
Definitions z = density at t K = Proportion of the population that are diseased Density Phenotypic liability i = mean phenotypic liability of the diseased group t = threshold 6
Liability Threshold Model truncated normal distribution theory (x) =cumulative density until liability x standard normal distribution function (x) = probability density at x Phi z = density at t z = (t) = dnorm(t) K = Proportion of the population that are diseased Density Standard Deviation =1 p = 1 K= 1- (t) = 1-pnorm(t) Phenotypic liability i = mean phenotypic liability of the diseased group i= z/K selection intensity Variance in liability amongst the diseased individuals = ((1-k), where k = i(i-t) t = threshold t= -1(1-K) = qnorm(1-K) Inverse standard normal distribution (probit) function 7
Falconer (1965) t The difference between the means for the same threshold m The difference between the thresholds when standardised to have the same mean mR tR mR-m = t-tR Given the difference in thresholds, and given known additive genetic relationship between relatives, what proportion of the total variance must be due to genetic factors Falconer (1965) The inheritance of liability to certain diseases, estimated from incidences in relatives, Ann. Hum Genet. 29 51 Crittenden (1961) an interpretation o familial aggregation based on multiple genetic and environmental factors Ann NY Acad Sci 91 769 8
Calculate heritability of liability using regression theory Y = phenotypic liability for individuals YR = phenotypic liability for relatives of Y E(Y) = E(YR) = m = 0 z K m t i Relationship between YR and Y is linear YR = m + bYR.YY+ = m + cov(AR,A) Y + , since m = 0 Var(Y) = Y + = aRh2Y+ Falconer (1965) The inheritance of liability to certain diseases, estimated from incidences in relatives, Ann. Hum Genet. 29 51 Crittenden (1961) an interpretation o familial aggregation based on multiple genetic and environmental factors Ann NY Acad Sci 91 769 9
Calculate heritability of liability using regression theory Y = phenotypic liability for individuals YR = phenotypic liability for relatives of Y YR = aRh2Y+ z K m t i For affected individuals Y = i Expected phenotypic liability of relatives of those affected E(YR|Y>t) = mR = mR-m = t- tR Substitute t- tR= aRh2i Rearrange h2 =(t- tR)/iaR Falconer (1965) The inheritance of liability to certain diseases, estimated from incidences in relatives, Ann. Hum Genet. 29 51 Crittenden (1961) an interpretation o familial aggregation based on multiple genetic and environmental factors Ann NY Acad Sci 91 769 10
Assumptions made by Falconer (1965) Assumption: Covariance between relatives reflects only shared additive genetic effects Check: Use different types of relatives with different aR and different uR(dominance coefficient) and different shared environment to see consistency of estimates of h2 Assumption: Phenotypic variance in relatives is unaffected by ascertainment on affected probands 11
Accounting for reduction in variance in relatives as a result of ascertainment on affected individuals t Variance in liability amongst the diseased individuals = ((1-k), where k = i(i-t) P m Variance in liability amongst relatives of diseased individuals V(YR|Y>t) = V(YR)-kCov(YR,Y)2 = PR mR Reich, James, Morris (1972) The use of multiple thresholds in determining the mode of transmission of semi-continuous traits. Ann Hum Gen 36: 163. 12
Reich et al: heritability of liability The difference between the means for the same threshold t The difference between the thresholds when standardised to have the mean 0 and variance 1 m mR tR mR-m = t-tR Reich, James, Morris (1972) The use of multiple thresholds in determining the mode of transmission of semi-continuous traits. Ann Hum Gen 36: 163. 13
Reich et al: heritability of liability Y = phenotypic liability for individuals YR = phenotypic liability for relatives of those with Y t YR = aRh2Y+ For affected individuals Y = i Expected phenotypic liability of relatives of those affected E(YR|Y>t) = mR-m = Substitute Rearrange Also useful calculation of tR when K and h2 are known 14
Single locus disease model Single locus disease model: G = genotype; D=disease; K = overall disease risk in population; p = risk allele frequency; f0 = baseline risk for homozygote reference allele UNKNOWN R = relative risk for heterozygote; assume risk is multiplicative (on this scale) How do we go from single locus model to multiple risk locus model ? 15
Two-locus risk model Single locus disease model: G = genotype; D=disease; K = overall disease risk in population P(D) P(G) Sum P(D) = K f0 = probability of disease with no risk alleles. This baseline probability differs between the models 16
How to combine risk loci to explain disease Additive on disease scale Multiplicative on disease scale Constrained multiplicative on disease scale Multiplicative Odds on disease scale Liability threshold model 17
Exchangeable models of disease High heritability Requires there be a large variance in risk among individuals. Consequently risk considered as a function of the number of causative alleles has to be steeply increasing. Multiplicative model standard model used but allows probability of disease to be >1. P(Disease)=P(Disease|x=0)Rx Constrained multiplicative model constrain the multiplicative model to have a maximum probability of 1 Probability of disease Additive model P(Disease)=b+xR, b=-18/7 set P(Disease)<0 to 0 and P(Disease)>1to 1 Number of risk alleles(x) Slatkin (2008)Exchangeable models of complex inherited diseases Genetics 18
Which polygenic model to use? The liability threshold model is the model of choice because It is the simplest parameterization that fits the observable data It is mathematically tractable It makes least assumptions about genetic architecture All models are wrong some models are useful 19
Jumping ahead REML lectures Jian Yang/Peter Visscher Estimation of proportion of variance attributable to genome-wide SNPs: SNP-heritability 20
Jumping ahead REML lectures Jian Yang/Peter Visscher Estimation of proportion of variance attributable to genome-wide SNPs: SNP-heritability 21 Vinkhuyzen et al (2013) Estimation and Partition of Heritability in Human Populations Using Whole-Genome Analysis Methods Annual reviews of genetics.
GREML: h2-SNP for disease Use linear regression Estimate on observed scale Transform to Liability scale via Robertson Transformation Observations are on disease scale but heritability is most interpretable on the liability scale Case-control samples are ascertained Up date transformation Very stringent QC Differences between case and control samples may reflect artefacts 22 Lee et al (2011) Estimating missing heritability for Disease from GWAS AJHG Lee et al (2013) Estimation and partition of polygenic variation captured by common SNPs for AD, MS & Endo, HMG
Ascertainment in case-control studies Estimate of proportion of variance explained by SNP between cases and controls z x t Unaffected (1-K) affected (K) Control (1-P) Case (P) Robertson (1950) Appendix of Dempster and Lerner (1950) See Lecture 1 Lee et al (2011)AJHG Zhou & Stephens (2013) Polygenic Modeling with Bayesian Sparse Linear Mixed Models PLoSG Text S3 Golan et al (2014) Measuring missing heritability: Inferring the contribution of common variants PNAS 23
Summary If a disease affects 1% of the population and has heritability 80% We have shown why these statements are consistent : If an individual is affected ~8% of his/her siblings affected If an MZ twin is affected ~50% of their co-twins are affected 24


")


")


")