Effective Root Cause Analysis for Problem Resolution

In the process of determining the root cause of a problem, it is crucial to look beyond initial reactions and symptoms. Root Cause Analysis focuses on identifying underlying factors, not blaming individuals. By analyzing significant events and repetitive errors or failures, a systematic approach can lead to effective problem resolution, preventing future issues and improving overall performance.
- Root Cause Analysis
- Problem Resolution
- Systematic Approach
- Effective Solutions
- Performance Improvement

Download Presentation

Please find below an Image/Link to download the presentation.
The content on the website is provided AS IS for your information and personal use only. It may not be sold, licensed, or shared on other websites without obtaining consent from the author. Download presentation by click this link. If you encounter any issues during the download, it is possible that the publisher has removed the file from their server.
E N D
Presentation Transcript
Riverhawk World Class Solutions for Global Applications World Class Solutions for Global Applications Determining the Root Cause and Determining the Root Cause and Corrective Action of a Problem Corrective Action of a Problem 7/16/2024
Prevent problems from recurring Reduce possible injury to personnel Reduce rework and scrap Increase competitiveness Promote happy customers Ultimately, reduce cost and save money 7/16/2024
Invariably, the root cause of a problem is not the initial reaction It is not just restating the Finding or Symptom 7/16/2024
For example, a normal response is: Equipment Failure Human Error Initial response is usually the symptom, not the root cause of the problem. This is why Root Cause Analysis is a very useful and productive tool. 7/16/2024
Such as: Process or program failure System or organization failure Poorly written work instructions Lack of training 7/16/2024
Root Cause Analysis is an in-depth process or technique for identifying the most basic factor(s) underlying a (problem). Focus is on systems and processes Focus is not on individuals 7/16/2024
Significant or consequential events Repetitive human errors are occurring during a specific process Repetitive equipment failures associated with a specific process Performance is generally below desired standard May be MRR/SCAR driven 7/16/2024
Assign the task to a person/team knowledgeable of the systems and processes involved Define the problem Collect and analyze facts and data Develop theories and possible causes - there may be multiple causes that are interrelated Systematically reduce the possible theories and possible causes using the facts 7/16/2024
Develop possible solutions Define and implement an action plan (e.g., improve communication, revise processes or procedures or work instructions, perform additional training, etc.) Monitor and assess results of the action plan for appropriateness and effectiveness Repeat analysis if problem persists- if it persists, did we get to the root cause? 7/16/2024
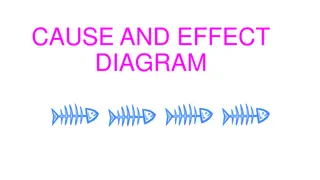
The 5 Whys Pareto Analysis (Vital Few, Trivial Many) Brainstorming Cause and Effect Diagram (4 M S) Tree Diagram Benchmarking (after Root Cause is found) 7/16/2024
Problem - Flat Tire Why? Nails on garage floor Why? Box of nails on shelf split open Why? Box got wet Why? Rain thru hole in garage roof Why? Roof shingles are missing C/A Fix Roof 7/16/2024
Pareto Analysis Vital Few Supplier Material Rejections May 06 to May 07 180 160 140 120 100 80 60 40 20 Trivial Many Count 0 Supplier Incorrect Material EB Incorrect Material 60 % of Material Rejections EB Other Supplier Other Other Supplier Dimensions Supplier Missing Parts Supplier Cleanliness Supplier Documentation Supplier Wrong Configuration EB Documentation EB Dimension Supplier Marking Supplier Damaged Packaging Supplier Shelf Life Exceeded Workmanship ESD Packaging Supplier Rusted, Corroded EB Marking EB Damaged Supplier Lab Test Failure Defect Count Percent Cum % 162 32 32 13934 20 19 19 15 15 27 7 4 5966 70 74 78 80 83 14 14 11 3 86 89 91 93 94 96 96 97 97 98 9 2 7 1 7 1 3 1 3 1 3 1 3 1 2 0 2 0 1 0 5 1 4 4 3 3 3 2 98 99 99100 7/16/2024
Sit down as a group and review all ideas Assign someone to capture the thoughts (Whiteboard) Everyone participates until no one can think of another Why to ask Don t jump to conclusions too quickly 7/16/2024
Cause and Effect Diagram (Fishbone/Ishikawa Diagrams) EFFECT (RESULTS) S (METHODS) CAUSE Four M s Model MANPOWER - MAN/WOMAN METHODS OTHER EFFECT MACHINERY MATERIALS 7/16/2024
Cause and Effect Diagram Loading My Computer METHODS MAN/WOMAN Inserted CD Wrong Cannot Answer Prompt Question Not Following Instructions Instructions are Wrong Brain Fade Cannot Load Software on PC OTHER Not Enough Free Memory Power Interruption CD Missing Inadequate System Bad CD Wrong Type CD Graphics Card Incompatible Hard Disk Crashed MATERIALS MACHINERY 7/16/2024
Tree Diagram Result Cause/Result Cause/Result Cause Primary Causes Secondary Causes Result Tertiary Causes 7/16/2024
Tree Diagram Result Cause/Result Cause/Result Cause Lack of Models/ Benchmarks No Money for Reference Materials Stale/Tired Approaches No Outside Input Research Not Funded No Funds for Classes No Performance Reviews No Consequences Infrequent Inspections Poor Safety Performance Inappropriate Behaviors No Special Subject Classes Inadequate Training Lack of Regular Safety Meetings No Publicity Lack of Employee Attention Zero Written Safety Messages Lack of Sr. Management Attention No Injury Cost Tracking 7/16/2024
Benchmarking: What is it? "... benchmarking ...[is] ...'the process of identifying, understanding, and adapting outstanding practices and processes from organizations anywhere in the world to help your organization improve its performance.'" American Productivity & Quality Center "... benchmarking ...[is]... an on-going outreach activity; the goal of the outreach is identification of best operating practices that, when implemented, produce superior performance." Bogan and English, Benchmarking for Best Practices Benchmark refers to a measure of best practice performance. Benchmarking refers to the search for the best practices that yields the benchmark performance, with emphasis on how you can apply the process to achieve superior results. 7/16/2024
All process improvement efforts require a sound methodology and implementation, and benchmarking is no different. You need to: Identify benchmarking partners Select a benchmarking approach Gather information (research, surveys, benchmarking visits) Distill the learning Select ideas to implement Pilot Implement 7/16/2024
Successful application of the analysis and determination of the Root Cause should result in elimination of the problem 7/16/2024
Ending analysis at a symptomatic cause Assigning as the cause of the problem the why event that preceded the real cause Looking for a single cause- often 2 or 3 which contribute and may be interacting 7/16/2024
1. 2. 3. 4. 5. 6. Why determine Root Cause? What Is Root Cause Analysis? When Should Root Cause Analysis be performed? How to determine Root Cause Useful Tools to Determine Root Cause Five Whys Pareto Analysis Brainstorming Cause & Effect Diagram Tree Diagram Benchmarking Common Errors of Root Cause 7/16/2024