Essential Tools for Root Cause Analysis
Root Cause Analysis is a crucial process in problem-solving. Two essential tools discussed here are Brainstorming and the 5 Whys Analysis. Brainstorming involves generating ideas in a group session without criticism, followed by sorting and evaluating these ideas. The 5 Whys Analysis helps to drill down to the root cause of a problem by asking "why" multiple times. Effective implementation of these tools is key to identifying and addressing issues effectively.
Download Presentation

Please find below an Image/Link to download the presentation.
The content on the website is provided AS IS for your information and personal use only. It may not be sold, licensed, or shared on other websites without obtaining consent from the author. Download presentation by click this link. If you encounter any issues during the download, it is possible that the publisher has removed the file from their server.
E N D
Presentation Transcript
ESSENTIAL ROOT-CAUSE ANALYSIS TOOLS
Root-Cause-Analysis Tools: Brainstorming Phase 1: Find Ideas Phase 1: Find Ideas The first step is to search for ideas in a moderated group session. All participants are asked to name topics spontaneously if possible. These are noted on individual pieces of paper or cards. All thoughts are allowed. It is forbidden to criticize, reject or evaluate ideas. Phase 2: Sort and evaluate Phase 2: Sort and evaluate After a break, all ideas are now read out by the moderator and discussed, evaluated and sorted by the participants. At first, this is only about thematic connections and sorting out ideas that are not relevant to the problem Brainstorming" is a frequently used tool - but it is just as often used incorrectly or ineffectively. To get useful results from a brainstorming session, you should follow a structured and moderated process. Brainstorming in Root Cause Brainstorming in Root Cause Analysis is applicable when Analysis is applicable when facing Problem types of facing Problem types of simple complexity. simple complexity. screening for business health
Root-Cause-Analysis Tools: Brainstorming (cont.) To run an effective Brainstorming session, you should stick to 7 basic principles: Save the details Save the details Save the details for the end of the brainstorming session. Avoid discussing the benefits of an idea in too much detail in the beginning. This can rob the idea of its energy right from the start and prevent further Numbers and Names Numbers and Names Number and name the ideas so that they can be referred to again and again in the subsequent discussion without losing the overview. 03 suggestions 02 04 Boss at the end Boss at the end The safest way to make a brainstorming fail is to let the boss talk first. Employees do not want to Spread (physically) Spread (physically) 05 Spread as many flipcharts or tables around the room as possible so that participants can write down ideas (without having to stand in front of the whole group). 02 contradict. 05 01 Focus Focus Define the task or problem precisely with a targeted statement and make sure that the participants do not deviate from the topic. The first step in solving a problem is always to clearly define the starting 06 07 Physically active Physically active Use other tools that stimulate other parts of the brain: modelling clay, building blocks, play figures, tape, glue or scissors. Build your ideas. position. Maximum 60 Minutes Maximum 60 Minutes No brainstorming should last more than 60 minutes. A topic should be discussed for a maximum of 25 minutes - after that you should take a break. If necessary, take another 25 minutes afterwards. screening for business health
Root-Cause-Analysis Tools: 5 Whys The 5 Why s Analysis is a simple tool for drilling down on the problem statement until the root cause is identified asking WHY times. Problem Problem Customers rate Customers rate service Quality low service Quality low 1. Why 1. Why Because our response Because our response time for service inquires time for service inquires is to long is to long WHY 5 2. Why 2. Why Because we don t Because we don t have enough people have enough people working in Service working in Service It is applicable when you are It is applicable when you are looking at one major cause looking at one major cause and if it needs drill down to and if it needs drill down to arrive at one root cause arrive at one root cause Avoid intentional or unintentional bias while answering Find the right person who can answer Use other Tools complementary 3. Why 3. Why The number of customer The number of customer problems was clearly problems was clearly underestimated underestimated 4. Why 4. Why The product still has numerous The product still has numerous teething troubles and was not teething troubles and was not yet ready for the market yet ready for the market Root Cause Root Cause 5. Why 5. Why There was no systematic There was no systematic end end- -user testing before user testing before the product was launched the product was launched screening for business health
Root-Cause-Analysis Tools: 5 Whys (Example II) The 5 Why s Analysis is a simple tool for drilling down on the problem statement until the root cause is identified asking WHY times. Problem Problem Failures in Products are Failures in Products are 2 times the industry 2 times the industry average average 1. Why 1. Why There is often damage There is often damage in transit in transit WHY 5 2. Why 2. Why Packaging is Packaging is insufficient insufficient It is applicable when you are It is applicable when you are looking at one major cause and looking at one major cause and if it needs drill down to arrive at if it needs drill down to arrive at one root cause one root cause Avoid intentional or unintentional bias while answering Find the right person who can answer Use other Tools complementary 3. Why 3. Why Packaging specifications Packaging specifications are incomplete are incomplete 4. Why 4. Why There are no technical There are no technical specifications for specifications for packaging in the company packaging in the company Root Cause Root Cause 5. Why 5. Why No holistic No holistic Quality Strategy Quality Strategy screening for business health
Root-Cause-Analysis Tools: 5 Whys (cont.) 1 1 3 3 2 2 4 4 Agree on Agree on Problem Problem Check the Check the Cause Cause Execute the Execute the Whys Whys The Process of the 5 Whys is often subdivided in 4 main steps: Fix it Fix it Determine if a Cause is the Actual Root Cause. Every time you come across a cause, stop there and take some time to analyze if that is the root cause or not. You may have to repeat Step 2 & 3 a couple of times before coming to a conclusion about the actual root cause. Until and unless you define the problem properly, solving it is going to be an uphill task. Spend some time ensuring that you ve defined the problem well. The detailed your definition of the problem is, the easier will be for you to solve it. Fixing the problem alone is not going to give you the real value. Pay attention to fixing the error and the cause so you a prevent any future occurrences of the problem. Check one layer at a time and keep shooting a Why as soon as you come across a problem at every level. screening for business health
Root-Cause-Analysis Tools: Affinity Diagram The Affinity Diagram is a simple tool for putting together a large number of details and inter-related causes and group them according to broad topics. 1. Define the Problem 1. Define the Problem 2. Brainstorm Root Causes 2. Brainstorm Root Causes This helps in focussing on the bigger picture and major root causes. It is applicable when looking It is applicable when looking at several, inter at several, inter- -related and detailed causes which have detailed causes which have some things in common and some things in common and can be grouped together to can be grouped together to see the major causes see the major causes Growth was to fast Not enough phone lines Staff feel unappreciated Not enough Staff Untrained Staff related and No Why is our customer service sub-standard? Staff aren t compensated Staff not motivated Not enough Top-Level Support Guidelines and no Control 3. Group inter 3. Group inter- -related causes related causes Not enough phone lines No Guidelines and no Control Staff aren t compensated Staff not motivated Staff feel unappreciated Growth was to fast Not enough Top-Level Support Not enough Staff Untrained Staff screening for business health
Root-Cause-Analysis Tools: Affinity Diagram (cont) 3. Leadership Issues 4. 4. Not enough Top-Level Support Staff not motivated Staff feel unappreciated Identify Identify the the major major causes causes 2. Lack of processes No Guidelines and no Control 4. Resources and Tools 1. Human Resources Issues Not enough phone lines Untrained Staff Not enough Staff Staff aren t compensated screening for business health
Root-Cause-Analysis Tools: Pareto Analysis The Pareto Chart is used to show the relative importance of a set of measurements. The Pareto Analysis enables you to: Frequency Cumulative % 100% 99% 44 96% 100% 45# 88% 90% 40# 80% 80% - Identify the most important Identify the most important improvement areas improvement areas 35# 71% 32 70% 30# 60% - Identify the most important Identify the most important causes to address causes to address 56% 25# 50% 20 20# 40% - Prioritize the most important Prioritize the most important solutions to implement solutions to implement 15# 13 32% 30% 11 10 10# 20% - Show improvement over time Show improvement over time (when executed and compared (when executed and compared regularly) regularly) 4 5# 10% 2 0% 0# Error 1 Error 2 Error 3 Error 4 Error 5 Error 6 Error 7 Error 8 - Identify follow Identify follow- -up actions up actions screening for business health
Root-Cause-Analysis Tools: Pareto Analysis (cont.) The Pareto Analysis uses the Pareto Principle which is also known as the 80/20 rule: 80/20 rule: Determine the categories and the units for comparison of the data, such as frequency, cost, or time. Total the raw data in each category, then determine the grand total by adding the totals of each category. 01 01 02 02 Re-order the categories from largest to smallest. 03 03 04 04 Determine the cumulative percent of each category Ideas behind the principle: Ideas behind the principle: - 80% of problems are traced to 20% of the causes - 80% of the tasks can be completed in 20% of the disposable time. The remaining 20% of tasks will take up 80% of the time - 80% of the productivity can be achieved by doing 20% of the tasks Draw and label the left-hand vertical axis with the unit of comparison, such as frequency, cost or time 05 05 06 06 Draw and label the one vertical axis from 0 to 100 percent Beginning with the largest category, draw in bars for each category representing the total for that category Draw a line graph beginning to represent the cumulative percent for each category as measured on the Percentage Axis 07 07 08 08 Analyze the chart. Usually the top 20% of the categories will comprise roughly 80% of the cumulative total 09 09 screening for business health
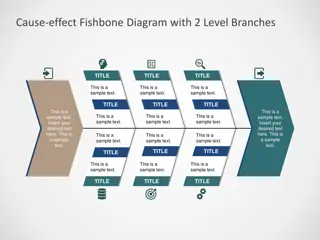
Root-Cause-Analysis Tools: Fishbone Diagrams The Fishbone Diagram is a tool used for identifying the root cause based on Cause & Effect relationship. They are also called Cause and Effect or Ishikawa Diagrams Fishbone Diagrams are very useful for the analysis of complex problems Grouping the courses can be based on the major cause analysis shown previously External Environment Project Management Management 1 1 3 3 5 5 New Competitor with new technology New Customer Behavior No Change Management No Project Controlling Disregard of R+D A A A Lack of Market Research B B B Reduced Reduced Competitiveness Competitiveness structure does not correspond to Project Management Contradiction between Duties and Power Structure No Standards for Quality Management Lack of Motivation Lack of Training No Process Controlling The Fishbone Diagram is applicable The Fishbone Diagram is applicable when looking at numerous major when looking at numerous major causes and you need drill down to causes and you need drill down to arrive a numerous root causes based arrive a numerous root causes based on their Cause and Effect Relationships on their Cause and Effect Relationships 2 2 4 4 6 6 Process Approach People screening for business health
Root-Cause-Analysis Tools: Fishbone Diagrams (cont.) To build a good and actionable Fishbone diagram: Be sure everyone agrees on the effect or problem statement before beginning Be succinct For each node, think what could be its causes. Add them to the tree Pursue each line of causality back to its root cause Consider grafting relatively empty branches onto others Consider splitting up overcrowded branches Consider which root causes are most likely to merit further investigation Form a small team of people with complementary skills to work on the problem Write down the key effect or symptom at the center-right of the page and draw a horizontal 01 01 02 02 spine Use Brainstorming to build the diagram, adding causes or cause areas to the appropriate ribs or sub-ribs as they Draw the main cause area 'ribs' 03 03 04 04 appear Discuss why the found causes are there Plan and implement actions to address key causes 05 05 06 06 screening for business health
Root-Cause-Analysis Tools: Interviewing Be prepared Be prepared Open Open- -Ended Ended When interviewing your staff on problems and root causes, it is important to ask the right questions in the right way otherwise you won t get actionable information. Collect relevant data first in order to ask the right questions. Ask open ended questions. No consulting No consulting Responsibility Responsibility Focus on the people responsible but get information from all relevant people. Don t lead or consult during the interviews let somebody else conduct the interview if you think your presence might Current and Future Current and Future Consider actual and potential problems. influence. All levels All levels Question people on all levels in the responsible functions in order to get a comprehensive view on the problem. screening for business health
Root-Cause-Analysis Tools: Fault Trees Terminology Name Form Description A fault tree is a graphical representation of the logical structure displaying the relationship between an undesired potential event (top event) and all its probable causes. Top-down approach to failure analysis Starting with a potential undesirable event (top event) Determining all the ways in which it can occur Mitigation measures can be developed to minimize the probability of the undesired event AND gate To show that the output event occurs only if all the input events occur OR gate To show that the output event occurs only if one or more of the input events occurs A basic event requires no further development because the appropriate limit of resolution has been reached Basic event Intermediate event An intermediate event occurs because of one or more antecedent causes acting through logic gates A triangle indicates that the tree is developed further at the occurrence of the corresponding transfer symbol A diamond is used to define an event which is not further developed either because it is of insufficient consequence or because of insufficient information Transfer Underdeveloped event screening for business health
Fault Trees (Steps) The Fault Tree Analysis is executed in 5 major steps: Fault tree analysis is a logic diagram for finding deductive failures in which using logic flows to combine different lower-level factors. It is also used for tracing all possible important factors and branches of events. Normally the more complex the case is, the more extensive the framework of fault tree framework will be. Define Define 1 1 Structure Structure 2 2 Explore Explore 3 3 Analyze Analyze 4 4 Decide Decide 5 5 Break down each event as much as possible. If failure means having stock left over from a pop up sale, your intermediate events could be 1) venue problems AND/OR 2) stock problems AND/OR 3) seller problems. Define the system and determine the top event. What s the scope of the issue or system that you re analyzing? What constitutes failure ? How will this impact my business? Explore each branch in successive detail. Continue the top-down process until the root cause for each branch is identified (basically, when you can t decompose further). Analyze and solve the fault tree. Now that you know all the possible causes of failure, you can analyze the fault tree and create a plan of action to address risk factors. Perform corrections and make decisions. This is the last step in the failure tree analysis method. You have your plan of action all that s left to do now is implement it. screening for business health
Fault Trees (Example) Fault trees can help to: Quantifying probability of top event occurrence Evaluating proposed system architecture attributes Assessing design modifications and identify areas requiring attention Complying with qualitative and quantitative safety/reliability objectives Qualitatively illustrate failure condition classification of a top- level event Establishing maintenance tasks and intervals from safety/reliability assessments Sales on the Web shop are low Shop has technical issues People not buying Lack of goods Lack of Goods Low Availability of product is low Economy slow sales everywhere Inventory / no sufficient stock Price is too high Product Appeal Internet is slow Software is outdated screening for business health
Fault Trees (Rules) Be as specific as possible Replace abstract events by less abstract events The construction of fault trees is a process that evolved gradually over years and has been adopted by many different functions and sectors. But what is important: Successful fault trees are drawn in accordance of basic rules. Specificity Specificity Use classifications Classify an event into more elementary events Classifications Classifications Identify distinct causes for an event Distinctive Distinctive Couple trigger events with no protective action Protectiveness Protectiveness Pinpoint a component failure event Pinpoint Pinpoint screening for business health
Root-Cause-Analysis: Hints and Tips It is important to select the right team to carry out the Root Cause Analysis. Members should have the knowledge of the process and should be able to explore the why, what and how Don t jump in with solutions: the problem and the solution may not be obvious Make sure you are aware of the causal relationships not just for the issue but also for the solution Suggest improvements that you can implement and are owned and signed up to by your team Having a facilitator with experience in the process will make things easier Practicing the tools and techniques will ensure that you maintain the skills needed Only take responsibility for actions over which you have control: Don t agree on an action plan for something you can t implement To perform a successful Root Cause Analysis you should observe a few basic rules. screening for business health
Root-Cause-Analysis Tools: Pitfalls Not understanding the problem and therefore not defining it correctly Not asking for help (internally and externally) Not considering all possible failure causes Not identifying all root causes Not understanding how the system should operate Runaway tests and analysis Adopting a remove & replace mentality Returning the part/product without analysis Failing to follow-through Jumping to conclusions Tearing a system apart without a plan Root Cause Analysis needs some practice - but if you follow the above rules while avoiding the adjacent pitfalls, it is a very helpful tool. screening for business health


