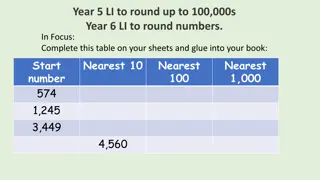
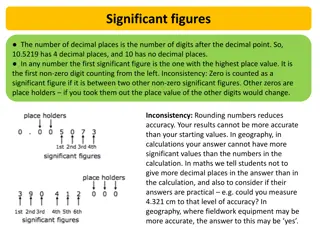
Understanding Upper and Lower Bounds in Rounding and Estimating
Learn how to calculate upper and lower bounds and error intervals when rounding numbers to significant figures. Practice rounding to different significant figures and apply the concept to various numerical values. Develop a solid grasp of estimation techniques with informative examples and visual aids.

Download Presentation

Please find below an Image/Link to download the presentation.
The content on the website is provided AS IS for your information and personal use only. It may not be sold, licensed, or shared on other websites without obtaining consent from the author. Download presentation by click this link. If you encounter any issues during the download, it is possible that the publisher has removed the file from their server.
E N D
Presentation Transcript
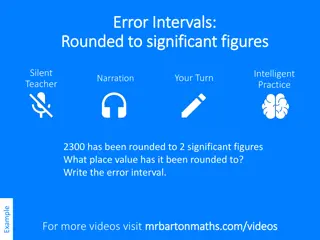
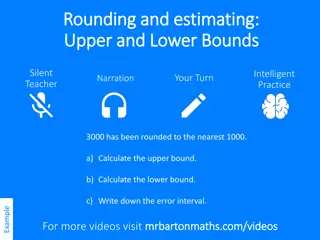
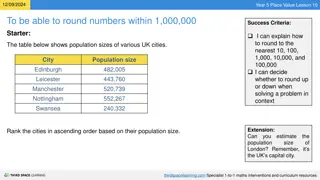
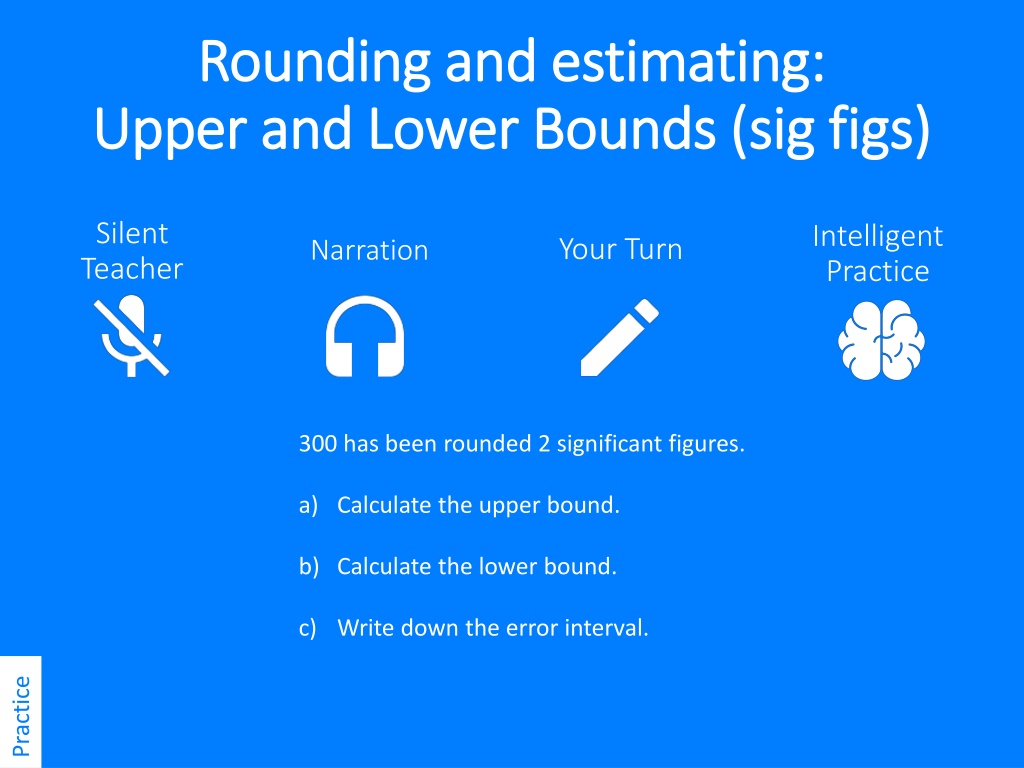
Rounding and estimating: Rounding and estimating: Upper and Lower Bounds (sig figs) Upper and Lower Bounds (sig figs) Silent Teacher Intelligent Practice Your Turn Narration 300 has been rounded 2 significant figures. a) Calculate the upper bound. b) Calculate the lower bound. c) Write down the error interval. Practice
Worked Example Your Turn 300 has been rounded 2 significant figures. 300 has been rounded to 3 significant figures. a) Calculate the upper bound. a) Calculate the upper bound. b) Calculate the lower bound. b) Calculate the lower bound. c) Write down the error interval. c) Write down the error interval. @mathsmrgordon
Worked Example Your Turn 7 has been rounded to 1 significant figure. 8 has been rounded to 2 significant figures. a) Calculate the upper bound. a) Calculate the upper bound. b) Calculate the lower bound. b) Calculate the lower bound. c) Write down the error interval. c) Write down the error interval. @mathsmrgordon
Value Rounded to Place value + / - Lower Bound Upper Bound Error Interval 1 significant figure 400 3 significant figures 400 2 significant figures 400 2 significant figures 40 2 significant figures 4 1 significant figure 4 1 significant figure 0.4 1 significant figure 0.3 2 significant figures 30 1 significant figure 0.03 @mathsmrgordon
Value Rounded to Place value + / - Lower Bound Upper Bound Error Interval 1 significant figure 100 + / - 50 350 450 350 x < 450 400 399.5 x < 400.5 3 significant figures Whole + / - 0.5 399.5 400.5 400 395 x < 405 2 significant figures Tens + / - 5 395 405 400 39.5 x < 40.5 2 significant figures Whole + / - 0.5 39.5 40.5 40 3.95 x < 4.05 2 significant figures Hundredths + / - 0.05 3.95 4.05 4 3.5 x < 4.5 1 significant figure Whole + / - 0.5 3.5 4.5 4 0.35 x < 0.45 1 significant figure Tenths + / - 0.05 0.35 0.45 0.4 0.25 x < 0.35 1 significant figure Tenths + / - 0.05 0.25 0.35 0.3 29.5 x < 30.5 2 significant figures Whole + / - 0.5 29.5 30.5 30 0.025 x < 0.035 1 significant figure Hundredths + / - 0.005 0.025 0.035 0.03 @mathsmrgordon