Understanding Power System Inertia in Inverter-Dominated Networks
This study explores the impact of high levels of instantaneous inverter-based renewable energy penetration on power system inertia. It delves into fundamental concepts of energy balance, frequency control, load/frequency characteristics, and the importance of system inertia in maintaining grid stability. The analysis highlights how system inertia supports frequency stability and why a decrease in inertia can lead to challenges such as rapid frequency changes and system vulnerabilities.

Download Presentation

Please find below an Image/Link to download the presentation.
The content on the website is provided AS IS for your information and personal use only. It may not be sold, licensed, or shared on other websites without obtaining consent from the author. Download presentation by click this link. If you encounter any issues during the download, it is possible that the publisher has removed the file from their server.
E N D
Presentation Transcript
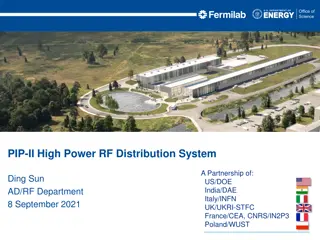
Power System Inertia in an Inverter- dominated Network WINDAC Mpeli Rampokanyo & Pam Kamera Nov 2018
Outline Purpose: to study the impact of high levels of instantaneous inverter based RE penetration on power system inertia. Energy Balance Concept Fundamental Concepts on Frequency control Background on Power System Inertia phenomenon Typical Frequency Response & Control Assumptions and Methodology Results of the study Conclusions 2
Frequency Control System Controlling the generator speed deviations, directly leads to controlling the MW output of the generator. The governor valve controls generator speed, boiler pressure and generator MW output 4
Load / Frequency Characteristics Non-motor load remains constant no matter what the frequency Motor load changes with system frequency Effect is that motor load gives a relieve on system frequency fall / rise System load provides damping effect on the gen/load imbalance during frequency events LFC in most countries has been observed to be between 3 % - 4% change of MW per Hz 5
System Inertia Inertia is defined as a body s resistance to change in motion. Generator inertia constant ? =?????? ?????????? ?????? ??????? [s] Where; ?????? ?????????? ?????? =1 2??2 [Ws] Where J is moment of inertia of the rotating Mass and w is speed in RPM of the rotating mass. System Inertia: n Hi MVAi i=1 MVAsystem [s] ???????= Where i represents a generator unit in the system 6
System Inertia contd (Salient points) Inertial Energy in the power system helps in arresting frequency deviations A heavily loaded system is stiffer (to frequency excursions) than a lightly loaded system because of the lager amount of rotating machinery in former. LFC and Inertial Energy in the system help in damping smaller frequency excursions even before Primary Governing can activate. The displacement of synchronous generators with static (non-rotating) Renewable generation leads to high erosion of natural system inertial energy and hence system becomes malleable to even minor frequency excursions more especially under light loading conditions. Rate of Change of Frequency (RoCoF) increases as a results of reduced system inertia resulting in normal relays failing to timeously detect this frequency excursions and hence resulting in catastrophes such as system black-outs. A weakly interconnected system is more prone to inertia degradation simply because it will not get enough support during frequency events 7
Assumptions & Methodology To assess the impact of depleting levels of inertia a 22 GW aggregated power system was used (similar to a total demand of a lightly loaded South African system). While the study tried to emulate the South African system, it must be realized the model used is not a true representation of the South African system as only generic model data was used and the network was aggregated. The results achieved here while may be close to what could be achieved in the full accurate representation of the South African system, only serve here as mere estimates of the actual reality. Studies were conducted for the minimum daytime load condition (22 GW) as this period coincides with maximum solar PV output, and hence lower inertia on the system. 9
Assumptions & Methodology contd. Increasing levels of RES penetration were simulated by replacing synchronous machines with inverter based generation. At each simulated penetration level, the calculated stored rotational energy, based on the synchronous machines that are online, is used to reflect the system inertia. This measure does not account for the inertia provided by rotating loads, (it is assumed that this is minimal). RoCoF is calculated directly from the slope of the frequency response curve. For the purposes of the study, the South African Grid Code requirements were used to assess the adequacy of the network. The system was setup with 800 MW of instantaneous reserves. 10
Assumptions & Methodology contd. The SA Grid Code requires the frequency to turn and remain above 49.5 Hz for a single credible contingency. The single credible contingency in the study was defined as loss of a largest unit at 1000 MW. Also according to SA Grid Code the Under Frequency Load shedding (UFLS) first stage is set at 49.2 Hz. This is considered when conducting the simulations. A DR load block of 1000 MW with a 4s and a 1s delay is also used as a mitigation to arrest frequency decay at different RE penetration levels. RE penetration levels reflected in here are instantaneous levels (i.e. actual generation levels at a specific time) and as such do not reflect installed levels installed levels will be higher than these values as capacity factors will have to be taken into account. These penetration levels are calculated based on 22500MW of loading 11
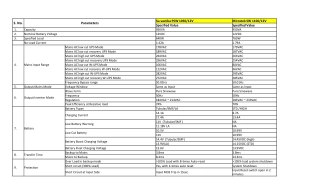
Assumptions & Methodology contd. Network Parameters used in the simulation study Parameter Value Minimum daytime load 22500 MW Frequency dead band 50 Hz 0.15 Hz Droop on governing units 4% Load frequency characteristic 4% per Hz Constant current Voltage dependent Load Type Demand response relay settings Frequency : 49.6 Hz Delay : 4 s and 1 s 12
Results - Impact of Increasing non-rotating RE on System Inertia 13
Results - Impact of Increasing non-rotating RE on System Inertia contd. Nadir Instantaneous Penetration Level Governing [MW] 756 797 808 832 797 770 Inertia [MWs] 138 000 125 000 114 000 96 000 68000 60000 RoCoF [Hz/s] -0.127 -0.152 -0.153 -0.228 -0.342 -0.375 [Hz] 49.540 49.512 49.500 49.455 49.274 49.200 [s] 6.16 5.88 5.10 4.39 3.92 4.01 0% 10% 20% 40% 60% 64% Grid Code limit of 49.5 Hz is maintained until 20% instantaneous penetration level. With increasing RE generation, rate of change of frequency (RoCoF) increases following a credible contingency on the network The frequency nadir starts encroaching on some Grid Code limit of 49.5 Hz and at 64% penetration the frequency nadir reaches the first stage of UFLS at 49.2 Hz. Therefore the inertia value of 64% with 375mHz/s RoCoF level can be regarded 14
Results Impact of DR as Mitigation 40% Scenario 15
Results Impact of DR as Mitigation 60% Scenario 16
Results Impact of DR as Mitigation 64% Scenario 17
Results summary Impact of DR as Mitigation The results show that if demand response is deployed, it helps with frequency response. More specifically, 4s delay on DR only helps with frequency recovery while frequency nadir is not improved at all. 1s delay setting on the DR has significant improvement in the nadir and hence it can be regarded as FFR technique. 1s delay results are summarized as follows: 50 mHz @ 40% penetration 100 mHz @ 60% penetration 129 mHz @ 64% penetration Slow demand response does not help in arresting the nadir of the frequency fall but rather frequency recovery. However shorter delays of DR relay settings leads to better nadir. Therefore it follows that FDR can be regarded as FFR technique that can easily be deployed to mitigate for high RoCoF levels. 18
Conclusions High RE penetration levels lead to system inertia degradation while rate of change of frequency (RoCoF) increases following a credible contingency on the network. For the particular system modeled here 64% RE penetration level with 375mHz/s RoCoF level can be regarded as critical limits for instantaneous penetration limits for this particular system based on the first stage of UFLS set at 49.2 Hz. At penetration levels exceeding 40%* the reserves utilised were no longer sufficient to comply with Grid Code requirements FDR can be regarded as FFR technique that can easily be deployed to mitigate for high RoCoF levels. A system at 100% penetration of RE generation will need a totally different frequency management strategy with a new suite of ancillary services to the current conventional system. 19 * In this model 40% instantaneous penetration could be achieved with as little as 9 GW of installed capacity of inverter based RE generation


")