Windchill Performance Tuning Webinar Insights

P
a
r
t
n
e
r
T
S
-
W
e
b
i
n
a
r
:
“
W
i
n
d
c
h
i
l
l
P
e
r
f
o
r
m
a
n
c
e
T
u
n
i
n
g
”
S
t
e
p
h
e
n
V
a
i
l
l
a
n
c
o
u
r
t
PTC Technical Support Fellow
Dec 20, 2013
Agenda
Takeaways
•
Common Themes of Windchill Performance Problems
•
Where can things go wrong?
•
How to Prevent Problems
•
Tools
•
What to capture when your customer has a performance problem
What makes up performance?
•
Performance is measured by one user but is determined by the load on
the system in the environment in which the system is running
# Active Users
End User Tasks
Background Operations
System Configurations
Server Hardware
Client Hardware
Network Bandwidth
Network Latency
Customizations
Software Versions
Bugs /#$!
What Really Matters?
Probable Causes of Performance problems
•
Database related
–
Most common cause of Performance problems
•
System misconfigurations
–
More common in newer systems & ones setup without guidance i.e. don’t use the out of the box
settings
•
Core code and Customization problems
–
How often they occur depends on a number of things, staying on the latest maintenance release
is the most effective strategy to minimize production problems from bugs
•
Client Side configuration
–
If using Wildfire or Creo there are a number of configuration changes which MUST be made
•
Infrequent – Problems occurring in dependent sub-system
–
Problems in the OS, disk I/O, corporate LDAP, Solr even the network would fit into this category
Configuring for Database Performance
•
Memory Allocation – Critical for acceptable Oracle performance
–
U
s
e
t
h
e
1
1
g
p
a
r
a
m
e
t
e
r
s
m
e
m
o
r
y
_
m
a
x
_
t
a
r
g
e
t
a
n
d
m
e
m
o
r
y
_
t
a
r
g
e
t
p
a
r
a
m
e
t
e
r
s
–
Set
sga_max_size
and
sga_target
equal to 0
–
Small to Medium sized systems SGA’s: 10 to 15G, Medium: 15G-30, Large up to 120G
–
S
e
t
o
p
t
i
m
i
z
e
r
_
i
n
d
e
x
_
c
o
s
t
_
a
d
j
=
1
0
–
i
m
p
o
r
t
a
n
t
b
u
t
n
o
t
a
s
c
r
i
t
i
c
a
l
a
s
i
n
e
a
r
l
i
e
r
r
e
l
e
a
s
e
s
o
f
O
r
a
c
l
e
•
Indexes (Oracle and SQLServer)
–
(R10.x)There is a list of recommended (50+) indexes which should be applied see article
CS98135
•
Problem identification (Oracle)
–
Check to see if the system is configured with enough SGA
post
–
Check to see if there are long running SQL statements impacting performance,
link
–
Introduction on how to interpret the
output from the Gather Info Script
–
How to approach tuning a SQL statement (
link
)
Server and Client Configurations for Performance
•
Server
–
Use the Windchill Configuration Assistant see chapter 1 of the
Administrator Configuration
Guide
–
S
e
t
t
h
e
d
b
.
p
r
o
p
e
r
t
y
w
t
.
p
o
m
.
q
u
e
r
y
L
i
m
i
t
s
(
i
t
’
s
n
o
t
s
e
t
b
y
t
h
e
W
C
A
)
–
The query limit is one of a couple of settings which can improve system stability. The others on
the list can be found
here
.
•
Work Group Manager Performance
–
Two recently re-worked article have everything needed:
•
Article CS24192
- Pro/ENGINEER Wildfire or Creo Interaction with PDMLink - Recommended Initial
Performance Server Settings
•
Article CS23960
- Pro/ENGINEER Wildfire and Creo Interaction with PDMLink - Recommended Initial
Performance Client Settings
•
N
e
w
F
u
n
c
t
i
o
n
a
l
P
a
t
c
h
f
o
r
1
0
.
1
M
4
0
-
r
e
s
o
l
v
e
s
i
s
s
u
e
s
w
i
t
h
c
o
m
m
u
n
i
c
a
t
i
o
n
b
e
t
w
e
e
n
t
h
e
W
i
n
d
c
h
i
l
l
W
o
r
k
g
r
o
u
p
M
a
n
a
g
e
r
c
l
i
e
n
t
a
n
d
W
i
n
d
c
h
i
l
l
s
e
r
v
e
r
[
P
a
t
c
h
A
v
a
i
l
a
b
l
e
D
e
c
2
0
1
3
]
Windchill property Considerations
What causes Partners problems?
•
Don’t allocate more memory to Method Servers than the machine has RAM
–
(
w
t
.
m
e
t
h
o
d
.
m
a
x
H
e
a
p
x
(
w
t
.
m
a
n
a
g
e
r
.
m
o
n
i
t
o
r
.
s
t
a
r
t
.
M
e
t
h
o
d
S
e
r
v
e
r
+
1
f
o
r
t
h
e
B
G
M
S
)
)
+
w
t
.
m
a
n
a
g
e
r
.
m
a
x
H
e
a
p
+
1
G
(
f
o
r
J
V
M
p
e
r
m
s
p
a
c
e
n
o
t
p
a
r
t
o
f
t
h
e
h
e
a
p
)
+
E
x
t
r
a
*
<
Total Memory of the server
E
x
t
r
a
*
=
m
e
m
o
r
y
n
e
e
d
e
d
f
o
r
o
t
h
e
r
r
u
n
n
i
n
g
a
p
p
l
i
c
a
t
i
o
n
s
(
A
p
a
c
h
e
,
W
i
n
d
c
h
i
l
l
D
S
,
d
a
t
a
b
a
s
e
…
)
a
n
d
t
h
e
O
S
•
JVM settings
–
Keep it simple, use the defaults. They are enough. Don’t let anyone short of a JAVA expert
touch your JVM settings, no “best practices” no exotic settings; KISS (Keep It Simple Stupid)
–
wt.method.maxHeap – 3g or more
•
Set the query Limits (I’m repeating myself; the limits are that important!)
–
(db.properties) wt.pom.queryLimit=250000
–
(db.properties) wt.pom.paging.snapshotQueryLimit=10000
–
(wt.properties) com.ptc.windchill.search.queryLimit=10000
Windchill Property Considerations Con’t
•
wt.properties
–
Load Balancing: Maximum number of concurrent Operations in a Single Method Server before
operation is balanced to a different Method Server (5-15 is a normal range)
•
w
t
.
m
e
t
h
o
d
.
l
o
a
d
b
a
l
a
n
c
e
.
a
c
t
i
v
e
C
o
n
t
e
x
t
–
Load Balancing: Number of times an operation can be moved to a different Method Server (# of
MS -1 is the usual setting)
•
w
t
.
m
e
t
h
o
d
.
l
o
a
d
b
a
l
a
n
c
e
.
m
a
x
R
e
d
i
r
e
c
t
s
–
The two MOST important caches in Windchill for Performance
•
w
t
.
c
a
c
h
e
.
s
i
z
e
.
W
T
P
r
i
n
c
i
p
a
l
C
a
c
h
e
&
w
t
.
c
a
c
h
e
.
s
i
z
e
.
S
t
a
n
d
a
r
d
U
f
i
d
S
r
v
S
e
r
v
i
c
e
$
R
e
m
o
t
e
O
b
j
e
c
t
I
d
C
a
c
h
e
•
See articles
CS71489
&
CS97931
for sizing instructions
•
Db.properties
–
w
t
.
p
o
m
.
m
a
x
D
b
C
o
n
n
e
c
t
i
o
n
s
(
t
y
p
i
c
a
l
r
a
n
g
e
:
1
0
-
2
5
,
m
a
y
b
e
h
i
g
h
e
r
f
o
r
B
G
M
S
w
i
t
h
m
a
n
y
q
u
e
u
e
s
)
–
wt.pom.minDbConnections (Typical range:10-25)
–
Use the defaults: wt.pom.statementCacheSize (50) & wt.pom.rowPrefetchCount (20)
Tools
New tools
•
Administrator JSP page available in R10 M20 and later
•
Product System Monitor (PSM)
–
Free to Customers on Maintenance
–
Constant Monitoring
–
Thread dumps
–
Alerts
–
Charting
–
More
www.ptc.com/go/psm
Related Materials
•
S
t
r
e
s
s
/
L
o
a
d
T
e
s
t
V
a
l
i
d
a
t
i
o
n
.
i
.
e
.
S
i
n
g
l
e
U
s
e
r
B
e
n
c
h
m
a
r
k
s
–
(
C
R
I
T
I
C
A
L
)
I
t
i
s
i
m
p
o
r
t
a
n
t
t
o
p
e
r
f
o
r
m
l
o
a
d
t
e
s
t
s
f
o
r
e
x
t
r
e
m
e
d
a
t
a
a
n
d
u
s
e
c
a
s
e
s
.
F
o
r
e
x
:
•
CheckIn/Out of very large assemblies, Very large searches & Very large reports
•
A
v
a
i
l
a
b
l
e
B
e
n
c
h
m
a
r
k
s
–
Manual Method
•
Windchill Creo Data Management Performance Benchmark Test - Instructions
•
Windchill Creo Data Management Performance Benchmark Test - Data Sheet
•
Windchill Creo Data Management Performance Benchmark Test – Preliminary Dataset (82 KB)
•
Windchill Creo Data Management Performance Benchmark Test – World Car Dataset (295 MB)
–
Automated Method
•
Windchill Single User Performance Tester for Creo Data Management Operations (SPT) - Instructions
•
Windchill Single User Performance Tester for Creo Data Management Operations (SPT) - Media
O
t
h
e
r
d
o
c
u
m
e
n
t
s
–
Windchill Deployment Planning Checklist
–
Windchill Vaulting and Replication Planning - Technical Brief
–
Windchill Server Hardware Sizing Guidelines
(Reference Documents)
•
General Case: Data to upload
–
wt and db properties
–
Oracle
•
Oracle Diagnostic report (latest version
available
here
)
•
AWR reports
–
SQLServer
•
SQLServer Reports
•
SQLServer Diagnostic report
–
MethodServer logs
•
Reproducible Case: Data to Capture
–
PSM Export
(Page 20)
or
–
Windchill Profile
Alternative to manual Data Collection:
Using the ‘SCC’
–
#Site tab #Utilities #System Configuration
Collector
What to do when there is a problem?
Open a Case with Technical Support
•
It’s Possible to have Acceptable Performance
–
Database, MethodServer Side and Client configurations are necessary
•
Not setting Query Limits will cause the MethodServer to crash
•
Most Performance problems related to Database interaction
–
Either poorly performing queries & under tuned databases
–
Code problem
•
There are experts at PTC who only work on performance problems,
capturing the right data and engaging them is the quickest way to
resolution
•
PSM is new(ish) tool and is a value add for customers
Summary
Explore common themes of Windchill performance issues and learn preventive measures to enhance system stability and user experience. Delve into database-related causes, system misconfigurations, and client-side configurations. Discover essential tips for optimizing database performance and server/client configurations. Stay updated with effective strategies to minimize production problems and ensure optimal system performance.

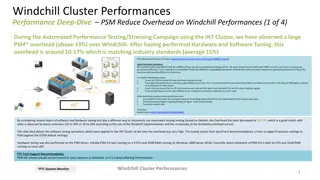
Download Presentation

Please find below an Image/Link to download the presentation.
The content on the website is provided AS IS for your information and personal use only. It may not be sold, licensed, or shared on other websites without obtaining consent from the author.If you encounter any issues during the download, it is possible that the publisher has removed the file from their server.
You are allowed to download the files provided on this website for personal or commercial use, subject to the condition that they are used lawfully. All files are the property of their respective owners.
The content on the website is provided AS IS for your information and personal use only. It may not be sold, licensed, or shared on other websites without obtaining consent from the author.
E N D
Presentation Transcript
Partner TS-Webinar: Windchill Performance Tuning Stephen Vaillancourt PTC Technical Support Fellow Dec 20, 2013
Agenda Takeaways Common Themes of Windchill Performance Problems Where can things go wrong? How to Prevent Problems Tools What to capture when your customer has a performance problem 2 2
What makes up performance? Performance is measured by one user but is determined by the load on the system in the environment in which the system is running # Active Users Client Hardware Software Versions 3
What Really Matters? Probable Causes of Performance problems Database related Most common cause of Performance problems System misconfigurations More common in newer systems & ones setup without guidance i.e. don t use the out of the box settings Core code and Customization problems How often they occur depends on a number of things, staying on the latest maintenance release is the most effective strategy to minimize production problems from bugs Client Side configuration If using Wildfire or Creo there are a number of configuration changes which MUST be made Infrequent Problems occurring in dependent sub-system Problems in the OS, disk I/O, corporate LDAP, Solr even the network would fit into this category 4 4
Configuring for Database Performance Memory Allocation Critical for acceptable Oracle performance Use the 11g parameters memory_max_target and memory_target parameters Set sga_max_size and sga_target equal to 0 Small to Medium sized systems SGA s: 10 to 15G, Medium: 15G-30, Large up to 120G Set optimizer_index_cost_adj=10 important but not as critical as in earlier releases of Oracle Indexes (Oracle and SQLServer) (R10.x)There is a list of recommended (50+) indexes which should be applied see article CS98135 Problem identification (Oracle) Check to see if the system is configured with enough SGA post Check to see if there are long running SQL statements impacting performance, link Introduction on how to interpret the output from the Gather Info Script How to approach tuning a SQL statement (link) 5 5
Server and Client Configurations for Performance Server Use the Windchill Configuration Assistant see chapter 1 of the Administrator Configuration Guide Set the db.property wt.pom.queryLimits(it s not set by the WCA) The query limit is one of a couple of settings which can improve system stability. The others on the list can be found here. Work Group Manager Performance Two recently re-worked article have everything needed: Article CS24192 - Pro/ENGINEER Wildfire or Creo Interaction with PDMLink - Recommended Initial Performance Server Settings Article CS23960 - Pro/ENGINEER Wildfire and Creo Interaction with PDMLink - Recommended Initial Performance Client Settings New Functional Patch for 10.1 M40 - resolves issues with communication between the Windchill Workgroup Manager client and Windchill server [Patch Available Dec 2013] 6 6
Windchill property Considerations What causes Partners problems? Don t allocate more memory to Method Servers than the machine has RAM (wt.method.maxHeap x (wt.manager.monitor.start.MethodServer + 1 for the BGMS) ) + wt.manager.maxHeap + 1G (for JVM perm space not part of the heap) + Extra* < Total Memory of the server Extra*= memory needed for other running applications (Apache , Windchill DS, database ) and the OS JVM settings Keep it simple, use the defaults. They are enough. Don t let anyone short of a JAVA expert touch your JVM settings, no best practices no exotic settings; KISS (Keep It Simple Stupid) wt.method.maxHeap 3g or more Set the query Limits (I m repeating myself; the limits are that important!) (db.properties) wt.pom.queryLimit=250000 (db.properties) wt.pom.paging.snapshotQueryLimit=10000 (wt.properties) com.ptc.windchill.search.queryLimit=10000 7 7
Windchill Property Considerations Cont wt.properties Load Balancing: Maximum number of concurrent Operations in a Single Method Server before operation is balanced to a different Method Server (5-15 is a normal range) wt.method.loadbalance.activeContext Load Balancing: Number of times an operation can be moved to a different Method Server (# of MS -1 is the usual setting) wt.method.loadbalance.maxRedirects The two MOST important caches in Windchill for Performance wt.cache.size.WTPrincipalCache & wt.cache.size.StandardUfidSrvService$RemoteObjectIdCache See articles CS71489 & CS97931 for sizing instructions Db.properties wt.pom.maxDbConnections (typical range: 10-25, maybe higher for BGMS with many queues) wt.pom.minDbConnections (Typical range:10-25) Use the defaults: wt.pom.statementCacheSize (50) & wt.pom.rowPrefetchCount (20) 8 8
Tools New tools Administrator JSP page available in R10 M20 and later Product System Monitor (PSM) Free to Customers on Maintenance Constant Monitoring Thread dumps Alerts Charting More www.ptc.com/go/psm 9 9
Related Materials Stress / Load Test Validation. i.e. Single User Benchmarks (CRITICAL) It is important to perform load tests for extreme data and use cases . For ex: CheckIn/Out of very large assemblies, Very large searches & Very large reports Available Benchmarks Manual Method Windchill Creo Data Management Performance Benchmark Test - Instructions Windchill Creo Data Management Performance Benchmark Test - Data Sheet Windchill Creo Data Management Performance Benchmark Test Preliminary Dataset (82 KB) Windchill Creo Data Management Performance Benchmark Test World Car Dataset (295 MB) Automated Method Windchill Single User Performance Tester for Creo Data Management Operations (SPT) - Instructions Windchill Single User Performance Tester for Creo Data Management Operations (SPT) - Media Other documents Windchill Deployment Planning Checklist Windchill Vaulting and Replication Planning - Technical Brief Windchill Server Hardware Sizing Guidelines (Reference Documents) 10 10
What to do when there is a problem? Open a Case with Technical Support Alternative to manual Data Collection: Using the SCC #Site tab #Utilities #System Configuration Collector General Case: Data to upload wt and db properties Oracle Oracle Diagnostic report (latest version available here) AWR reports SQLServer SQLServer Reports SQLServer Diagnostic report MethodServer logs Reproducible Case: Data to Capture PSM Export (Page 20) or Windchill Profile 11
Summary It s Possible to have Acceptable Performance Database, MethodServer Side and Client configurations are necessary Not setting Query Limits will cause the MethodServer to crash Most Performance problems related to Database interaction Either poorly performing queries & under tuned databases Code problem There are experts at PTC who only work on performance problems, capturing the right data and engaging them is the quickest way to resolution PSM is new(ish) tool and is a value add for customers 12