Visual Outcomes in Diabetic Retinopathy Trial
Explore the four-year visual outcomes in a randomized trial using intravitreous aflibercept for preventing vision-threatening complications of diabetic retinopathy. Anti-VEGF treatment effectiveness, study design, follow-up visits, and treatment protocols are detailed. Learn about the treatment strategies for proliferative diabetic retinopathy and center-involved diabetic macular edema outcomes.
Download Presentation

Please find below an Image/Link to download the presentation.
The content on the website is provided AS IS for your information and personal use only. It may not be sold, licensed, or shared on other websites without obtaining consent from the author. If you encounter any issues during the download, it is possible that the publisher has removed the file from their server.
You are allowed to download the files provided on this website for personal or commercial use, subject to the condition that they are used lawfully. All files are the property of their respective owners.
The content on the website is provided AS IS for your information and personal use only. It may not be sold, licensed, or shared on other websites without obtaining consent from the author.
E N D
Presentation Transcript
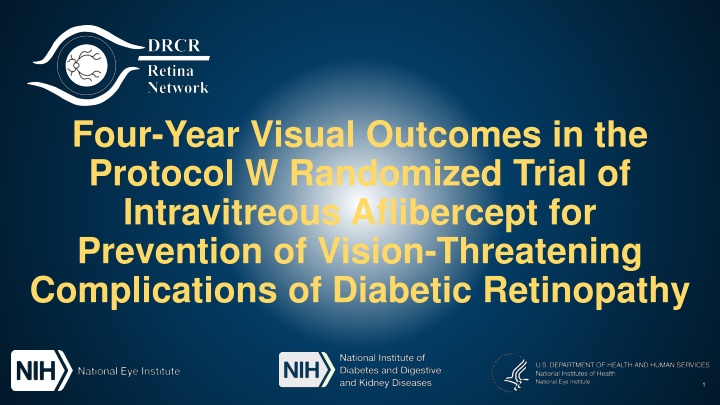
Four-Year Visual Outcomes in the Protocol W Randomized Trial of Intravitreous Aflibercept for Prevention of Vision-Threatening Complications of Diabetic Retinopathy 1
Anti-VEGF Treatment Anti-VEGF is effective treatment for center- involved DME and PDR. Can anti-VEGF prevent these vision threatening complications in high-risk eyes? If so, is there visual benefit associated with preventing these complications? 2
Protocol W: Study Design Randomized Multicenter Clinical Trial (N = 64 Sites) 18 years old with type 1 or type 2 diabetes Severe NPDR in at least 1 eye* DRSS between 43 and 53 on reading center grading No evidence of NV on FA within the 7 modified ETDRS fields Best-corrected VA letter score 79 (20/25 or better) No hx of DME/DR treatment within 12 months and 4 prior injections No prior PRP Primary Outcomes 2 mg Intravitreous Aflibercept Development of PDR or CI-DME with vision loss Sham Injection Visual acuity *NPDR determined by investigator; eyes with CI-DME were excluded. After 9 months of recruitment the lower cutoff was modified from 47B 3
Follow-Up Visits and Treatment Month 1 Month 2 Month 4 Month 8 Baseline (0) Month 16 Month 20 Month 12 Before 2 Years: Injections given at every visit Month 28 Month 32 Month 24 2 Years: Injections given if worse than mild NPDR (> level 35 on clinical exam) Month 40 Month 44 Month 36 Final Visit (48M) Participants and VA/OCT/Photo technicians masked to treatment 4
Study Design: PDR Outcome Treatment Following Outcome Treatment with aflibercept initiated if high risk PDR developed Re-treatment with aflibercept followed Protocol S algorithm NVD or NVE on fundus photos or FA TRD, VH, or pre-retinal hemorrhage from PDR on fundus photos, FA or clinical exam NVI, NVA, or NVG on clinical exam TX for PDR without meeting above criteria (anti-VEGF, vitrectomy, PRP)
Study Design: CI-DME Outcome Treatment Following Outcome Treatment with aflibercept initiated if CI-DME with VA loss developed Re-treatment with aflibercept followed Protocol T algorithm CI-DME on OCT with 10% increase in CST from baseline and VA loss from DME: 10 letters loss at a single visit or 5 to 9 letters loss at 2 consecutive visits TX for DME without meeting above criteria (anti-VEGF, corticosteroid, focal/grid laser) 6
Randomization 399 Eyes (328 participants; 36% bilateral) Included in the Primary Analyses 4-years N = 137 (75%)* Aflibercept N = 200 N = 200 N = 134 (73%)* Sham N = 199 N = 199 *Excluding deaths: Aflibercept, N = 17; Sham, N = 16. 7
Participant Baseline Characteristics Aflibercept N = 200 57 42% 94% 8.6 46% 15% 31% 5% 2% Sham N = 199 56 43% 88% 8.3 43% 16% 34% 5% 2% Age (y), median Female Type 2 Diabetes HbA1c (%), median White Black/African American Hispanic or Latino Asian Other Race/Ethnicity 8
Ocular Baseline Characteristics Aflibercept N = 200 Sham N = 199 Visual Acuity Median letter score 88 88 Snellen equivalent 84 Letter Score (20/20 or better) Median OCT CST, m (Spectralis equivalent) Prior DME treatment 20/20 20/20 78% 81% 283 283 10% 11% Anti-VEGF 4% 3% Focal/laser 6% 10% 9
Ocular Baseline Characteristics Aflibercept N = 200 Sham N = 199 Diabetic Retinopathy Severity Scale Graded by Reading Center Moderate NPDR: Level 43 17% 18% Moderately Severe NPDR: Level 47A 33% 31% Moderately Severe NPDR: Levels 47B D 27% 28% Severe NPDR: Level 53 24% 24% 10
PDR or CI-DME Development 100% Adjusted Hazard Ratio Aflibercept vs Sham = 0.40 (97.5% CI = 0.28, 0.57); P <0.001 Aflibercept Sham 80% Cumulative Percent 57% 60% 40% 34% 20% 0% 0 1 2 3 4 Year N at risk 200 175 147 119 95 199 154 108 75 64 12
PDR Development 100% Adjusted Hazard Ratio Aflibercept vs Sham = 0.42 (97.5% CI = 0.29, 0.61); P <0.001 Aflibercept Sham 80% Cumulative Percent 60% 49% 40% 28% 20% 0% 0 1 2 3 4 Year N at risk 200 177 151 126 103 199 158 123 94 80 13
CI-DME Development 100% Adjusted Hazard Ratio Aflibercept vs Sham = 0.51 (97.5% CI = 0.27, 0.97); P 0.02 Aflibercept Sham 80% Cumulative Percent 60% 40% 19% 20% 11% 0% 0 1 2 3 4 Year N at risk 200 180 159 139 124 199 175 146 121 108 14
PDR or CI-DME Development by Baseline DR Severity Adjusted Hazard Ratio (97.5% CI) 0.45 (0.15, 1.37) 0.44 (0.21, 0.93) 0.40 (0.21, 0.75) 0.35 (0.19, 0.67) N Aflibercept Sham Moderate NPDR (Level 43) Moderately Severe NPDR (level 47A) Moderately Severe NPDR (level 47B D) Severe NPDR (level 53) 68 26% 38% 126 26% 47% 109 38% 64% 96 46% 78% 15
Change in DR Severity at 4 Years 2 Step Worsening 2 Step Improvement 100% 100% Adjusted Odds Ratio Aflibercept vs Sham = 0.51 (97.5% CI = 0.28, 0.91); P =0.009 Adjusted Odds Ratio Aflibercept vs Sham = 2.97 (97.5% CI = 1.70, 5.19); P <0.001 80% 80% 60% 60% 54% 40% 40% 29% 23% 20% 20% 11% 0% 0% Aflibercept N = 127 Sham N = 123 Aflibercept N = 127 Sham N = 123 16
Visual Acuity Mean Change 10 Adjusted Mean Difference at 4-Years Aflibercept vs. Sham: -0.5 (-2.3, 1.3); P =0.52 Aflibercept Sham Visual Acuity Mean Change, 7.5 5 Letter Score 2.5 0 -2.4 -2.5 -2.7 -5 -7.5 -10 0 1 2 3 4 Year N = 137 N = 134 N = 200 N = 199 18
Treatments for PDR and DME Aflibercept Sham 4 Years N = 137 N = 134 1 PRP tx for PDR 1% 3% 1 aflibercept injection for PDR or DME 20% 40% 1 focal/grid tx for DME 7% 2% aflibercept injections, mean (SD) 8.7 (5.1) among sham eyes with 1 13.0 (3.7) 3.5 (5.5) 20
Safety 21
Ocular Adverse Events P Aflibercept N = 200 Sham N = 199 Value Endophthalmitis 2% 0% 0.10 Any retinal detachment 1% 1% 1.00 IOP increase 10 mmHg 8% 8% 1.00 IOP 30 mmHg 2% 6% 0.07 Overall frequency of endophthalmitis per aflibercept injection: 0.11% (3 of 2794). Aflibercept injections: Aflibercept group, N = 2231; Sham group, N = 563. 22
Systemic Adverse Events Aflibercept N = 129 Sham N = 128 Bilateral N = 71 P Value Any APTC event* 10% 11% 8% 0.53 Nonfatal myocardial infarction Nonfatal stroke 1% 2% 2% 1% 2% 2% Death due to vascular or unknown cause 7% 7% 4% Hypertension 14% 22% 11% *APTC = Antiplatelet Trialists Collaboration 23
Conclusion Among patients with NPDR (DRSS level 43-53) and good vision (20/25 or better) but without CI-DME, early aflibercept compared with initial observation and treatment if disease worsened resulted in A statistically significant reduction in the probability of developing PDR or CI-DME within 4 years No difference in visual acuity at 4 years 24


