Utilizing Machine Learning for Conversion and Bounce Analysis
Machine learning techniques such as deep learning and random forest are employed to analyze drivers of bounce and conversion rates in a Velocity 2016 New York event. The process involves vectorizing and balancing the data, smoothing it for optimal performance, and validating on separate datasets to prevent overfitting.
Download Presentation

Please find below an Image/Link to download the presentation.
The content on the website is provided AS IS for your information and personal use only. It may not be sold, licensed, or shared on other websites without obtaining consent from the author.If you encounter any issues during the download, it is possible that the publisher has removed the file from their server.
You are allowed to download the files provided on this website for personal or commercial use, subject to the condition that they are used lawfully. All files are the property of their respective owners.
The content on the website is provided AS IS for your information and personal use only. It may not be sold, licensed, or shared on other websites without obtaining consent from the author.
E N D
Presentation Transcript
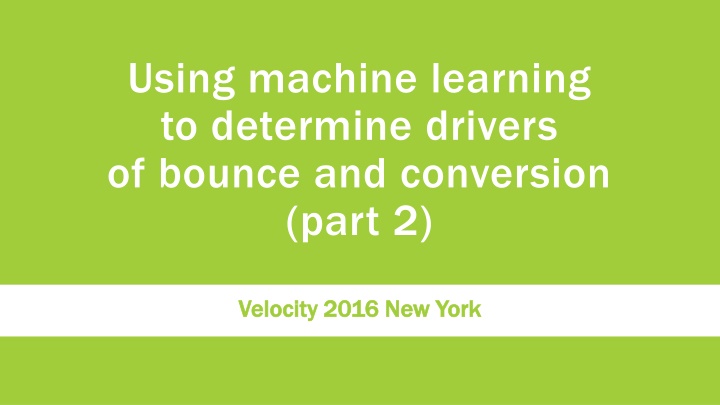
Using machine learning to determine drivers of bounce and conversion (part 2) Velocity 2016 New York Velocity 2016 New York
Tammy Everts Tammy Everts @ @tameverts tameverts Pat Pat Meenan Meenan @ @patmeenan patmeenan
What we did What we did (and why we did it) (and why we did it)
Get the code Get the code https://github.com/WPO https://github.com/WPO- -Foundation/beacon Foundation/beacon- -ml ml
Deep learning Deep learning weights
Random forest Random forest Lots of random decision trees Lots of random decision trees
Vectorizing Vectorizing the data Everything needs to be numeric Everything needs to be numeric Strings converted to several inputs as yes/no (1/0) Strings converted to several inputs as yes/no (1/0) i.e. Device manufacturer i.e. Device manufacturer Apple would be a discrete input Apple would be a discrete input Watch out for input explosion (UA String) Watch out for input explosion (UA String) the data
Balancing the data Balancing the data 3% conversion rate 97% accurate by always guessing no Subsample the data for 50/50 mix
Smoothing the data Smoothing the data ML works best on normally distributed data scaler = StandardScaler() x_train = scaler.fit_transform(x_train) x_val = scaler.transform(x_val)
Validation data Validation data Train on 80% of the data Validate on 20% to prevent overfitting Training accuracy from validation set
Input/output relationships Input/output relationships SSL highly correlated with conversions Long sessions highly correlated with not bouncing Remove correlated features from training Remove correlated features from training
Training random forest Training random forest clf = RandomForestClassifier(n_estimators=FOREST_SIZE, criterion='gini', max_depth=None, min_samples_split=2, min_samples_leaf=1, min_weight_fraction_leaf=0.0, max_features='auto', max_leaf_nodes=None, bootstrap=True, oob_score=False, n_jobs=12, random_state=None, verbose=2, warm_start=False, class_weight=None) clf.fit(x_train, y_train)
Feature Feature importances importances clf.feature_importances_
Training deep learning Training deep learning model = Sequential() model.add(...) model.compile(optimizer='adagrad', loss='binary_crossentropy', metrics=["accuracy"]) model.fit(x_train, y_train, nb_epoch=EPOCH_COUNT, batch_size=32, validation_data=(x_val, y_val), verbose=2, shuffle=True)
Understanding deep learning Understanding deep learning
Brute force FTW Brute force FTW 93 input features Train 93 models with 1 input Measuring the prediction accuracy of each Train 92 models with 2 inputs Top feature from first round Measure combined prediction accuracy Lather, rinse, repeat
Visualizing the model Visualizing the model Take trained model (X inputs) Vary inputs 100ms to 20 seconds in 100ms intervals Apply the data smoothing from training set model.predict_proba
What we learned What we learned
Whats in our beacon? What s in our beacon? Top Top- -level level domain, timestamp, SSL Session start time, length (in pages), total load time User agent browser, OS, mobile ISP Geo country, city, organization, ISP, network speed Bandwidth Timers base, custom, user-defined Custom metrics HTTP headers https://docs.soasta.com/whatsinbeacon/
Finding 1 Finding 1 Maybe everything doesn t after all doesn t matter
Bounce rate Bounce rate
Finding 2 Finding 2 DOM ready (aka DOM content loaded) and average session load time were the best indicators of bounce rate
Finding 3 Finding 3 When it came to getting high predictability, conversion data was tougher than bounce data
Finding 4 Finding 4 Pages with more scripts were more less likely to convert
Finding 5 Finding 5 The number of DOM elements matters a lot
Finding 6 Finding 6 Mobile-related measurements weren t meaningful predictors of conversions
Finding 7 Finding 7 Some conventional metrics were not as important as we thought
Importance Importance (bounce) (bounce) Feature Feature Start render 69 ~top 3
Things to watch out for Things to watch out for (other than dangling prepositions) (other than dangling prepositions)
Yep, checkout pages are SLOW Yep, checkout pages are SLOW
1. 1. 2. 2. 3. 3. 4. 4. 5. 5. YMMV YMMV Do try this at home Do try this at home Gather your RUM data (lots of it) Gather your RUM data (lots of it) Run the machine learning against it Run the machine learning against it If you get unexpected results, keep digging If you get unexpected results, keep digging
Thanks! @ @patmeenan patmeenan @ @tameverts tameverts
