Utilizing Bayesian Regression Models for Small Sample Education Decision-Making
Bayesian regression models can be valuable tools for addressing the challenges of small sample sizes in educational research, particularly in the Pacific Region where data availability is limited. These models offer advantages for conducting robust analyses and informing system-level education decisions. By leveraging Bayesian techniques, researchers can mitigate the impact of small sample sizes and enhance decision-making processes in education settings.

Download Presentation

Please find below an Image/Link to download the presentation.
The content on the website is provided AS IS for your information and personal use only. It may not be sold, licensed, or shared on other websites without obtaining consent from the author.If you encounter any issues during the download, it is possible that the publisher has removed the file from their server.
You are allowed to download the files provided on this website for personal or commercial use, subject to the condition that they are used lawfully. All files are the property of their respective owners.
The content on the website is provided AS IS for your information and personal use only. It may not be sold, licensed, or shared on other websites without obtaining consent from the author.
E N D
Presentation Transcript
Using Bayesian Regression Models in Small Sample Size Contexts to Support System-Level Education Decision-Making Christina Tydeman REL Pacific Bradley Rentz REL Pacific 1
REL Pacific 3 2 1 3
Agenda Introductions and overview. Bayesian regression models can help mitigate the effects of small sample sizes. Using Bayesian regression models to support education decision- making. 4
Objectives Illustrate how Bayesian regression models can provide many advantages for researchers working with small sample sizes. Share how REL Pacific has used Bayesian regression models to inform education decision making around college readiness on Pohnpei in the Federated States of Micronesia. 5
Bayesian regression models can help mitigate the effects of small sample sizes. 6
Small Sample Sizes in Quantitative Education Research Most system-level quantitative education studies conducted in the United States have access to large datasets with tens of thousands or more students, which enables them to conduct robust analyses. Occasionally education researchers have access to much smaller datasets; for example, when examining pilots of a new intervention in a few classrooms or schools or when working with small rural school districts. (Digital Atlas of Micronesia, 2021) 7
Small sample sizes are the norm in the Pacific Region. Even when conducting system-level education research, sample sizes are generally small. Many jurisdictions in the Pacific Region have relatively small populations. Most of the education systems in the region have about 2,000 15,000 students total from kindergarten through post-secondary education. (Digital Atlas of Micronesia, 2021) 8
Data missingness and irregularites also contribute to small sample sizes. Depending on the jurisdiction, education data may be incomplete, missing cohorts, lack unique identifiers, or have other irregulaties that may reduce sample sizes further. Some of these data issues may be mitigated through standard data imputation procedures, but others cannot. 9
Small sample sizes can complicate education research. Researchers may want to run (hierarchical) regression models that include predictor variables based on previous research and variables of interest identified by stakeholders. Small sample sizes can lead to models not being able to computationally converge on a solution. With small sample sizes, the model s results can be noisy and might not be sensitive enough to measure differences in the data accurately. Conversely, there might not be enough variation in the data if the outcome is relatively rare. 10
Prior Practices for Small Sample Sizes When faced with small sample sizes, researchers typically followed two approaches: collect more data and/or simplify the statistical analyses. Researchers in general have simplified statistical models by changing random effects to fixed effects, removing predictor variables, or using bivariate correlations and descriptive statistics instead of regression models. 11
Consequences of Prior Practices for Small Sample Sizes It may not be possible to collect more data, since researchers may have access to all existing data. Simplifying statistical models purely for computational reasons may affect the model s validity and usefulness for making policy decisions. 12
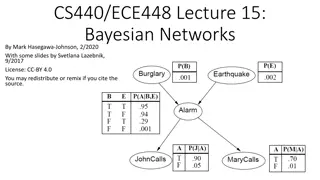
Bayesian regression models can help mitigate the effects of small sample sizes. Bayesian regression models are much less likely to have computational convergence errors even with small sample sizes, since they are calculated probabilistically using Markov chain Monte Carlo sampling methods and use prior information to fill in the gaps when there is limited data. (Kruschke & Liddell, 2018) 13
Bayesian regression models can also provide additional benefits to all datasets. Bayesian models can incorporate prior information about the relationship between predictor variables and the outcome variable. quantify the level of uncertainty after taking into account both the data and our prior knowledge about the data. (Kruschke & Liddell, 2018) 14
Using Bayesian Regression Models to Support Education Decision-Making 15
Using High School Data to Explore Early College Success on Pohnpei, Federated States of Micronesia REL Pacific recently used Bayesian generalized hierarchical modeling to examine associations of high school student variables with five community college outcomes for public high school graduates on Pohnpei. In the study, there were two samples: Sample 1: 1,146 students who took the College of Micronesia-FSM Entrance Test in grade 12 (88 percent of Pohnpei public high school graduates). Sample 2: 327 students from sample 1 who were admitted to the college and enrolled in a degree program in the summer or fall term after their high school graduation. The study included three cohorts and students from each of the island s three public high schools. (Rentz et al., 2021) 16
Study Methods The study team identified predictor variables that had posterior distributions different from the model s intercept by using a region of practical equivalence (ROPE). A small region close to zero was defined as the ROPE and determined to be substantively equivalent to zero. The percent of overlap of the 95 percent highest density interval with the ROPE for each predictor variable s posterior distribution was calculated. Predictor variables that had 0 percent overlap with the ROPE were identified as being statistically different from the intercept and were discussed in the report s main findings. For each identified statistically different predictor variable, predicted probabilities (conditional effects) of achieving the outcome were calculated. (Kruschke & Liddell, 2018) 17
Example Results (Rentz et al., 2021, p. 8) 18
Using Bayesian Regression Models: Results Using Bayesian hierarchical regression models instead of frequentists models allowed the study team to: Include predictor variables and random effect structure motivated by past research, the structure of the local school system, interests of stakeholders, and available data. Identify predictor variables that are statistically associated with community college outcomes after taking into account the prior uncertainty about data and the limited data due to small samples. Stakeholders at the Pohnpei Department of Education and the College of Micronesia-FSM are currently discussing ways to use the study results inform policy and practice changes to improve student outcomes. 19
Thank you for your time! Contact Information: Bradley Rentz brentz@mcrel.org Christina Tydeman ctydeman@mcrel.org 20
The reports for the Using High School Data to Explore Early College Success on Pohnpei, Federated States of Micronesia can be found on the IES website or via this QR code: 21
References Digital Atlas of Micronesia. (2021). Digital Atlas of Micronesia. https://islandatlas.org/ Kruschke, J. K., & Liddell, T. M. (2018). The Bayesian new statistics: Hypothesis testing, estimation, meta-analysis, and power analysis from a Bayesian perspective. Psychonomic Bulletin & Review, 25(1), 178 206. https://doi.org/10.3758/s13423-016-1221-4 Rentz, B., Holquist, S. E., Nardi, C. L., Simion, K., Martin, P., & Arens, S. A. (2021). Using High School Data to Explore Early College Success on Pohnpei, Federated States of Micronesia (REL 2021 092). U.S. Department of Education, Institute of Education Sciences, National Center for Education Evaluation and Regional Assistance, Regional Educational Laboratory Pacific. https://ies.ed.gov/ncee/edlabs/projects/project.asp?projectID=5667. 22
This presentation was prepared under Contract # ED-IES-17-C-0010 by Regional Educational Laboratory Pacific, administered by McREL International. The content does not necessarily reflect the views or policies of IES or the U.S. Department of Education, nor does mention of trade names, commercial products, or organizations imply endorsement by the U.S. Government. 23
Example Table Displaying Bayesian Regression Results (Rentz et al., 2021, p. C-3) 25