Understanding MIP Data on Marble for Visualizing and Analyzing
The MIP data on Marble provides information on where to access and process data related to Climate Model Intercomparison Projects (CMIP), including CMIP3 and CMIP5. It explains the data directories for different experiments, temporal resolutions available, and the models involved. It guides on how to visualize and analyze the data using tools like ncdump, Python, and Ferret, and provides insights on various experiments and variables available within the datasets.
Download Presentation

Please find below an Image/Link to download the presentation.
The content on the website is provided AS IS for your information and personal use only. It may not be sold, licensed, or shared on other websites without obtaining consent from the author. Download presentation by click this link. If you encounter any issues during the download, it is possible that the publisher has removed the file from their server.
E N D
Presentation Transcript
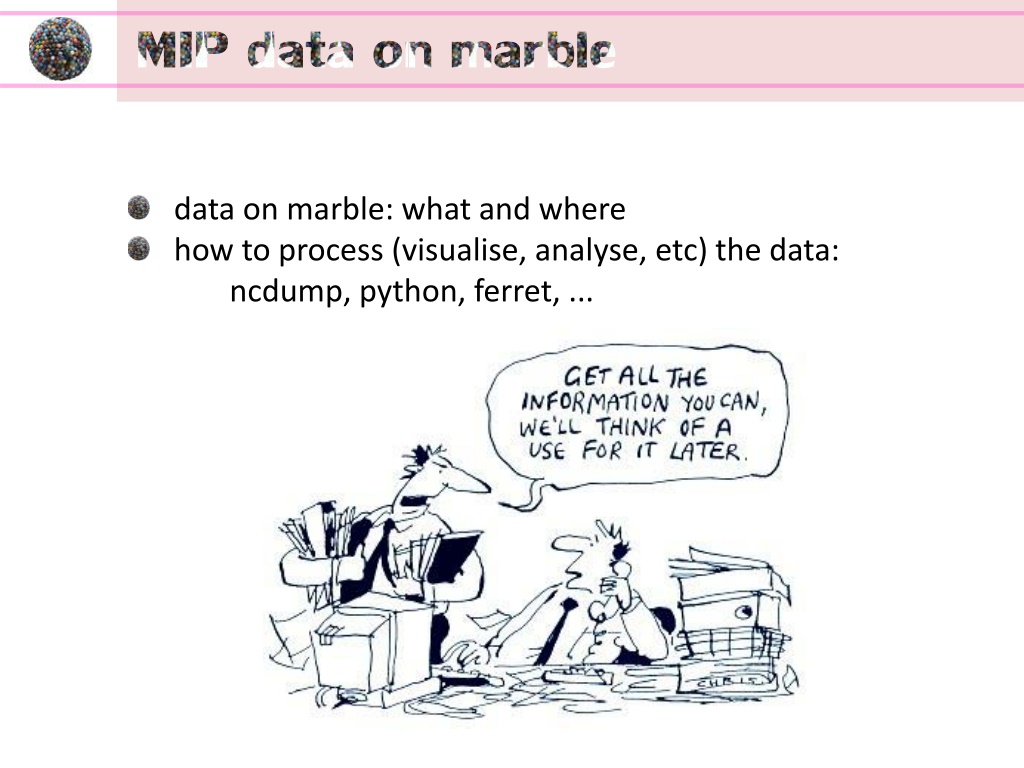
MIP data on marble data on marble: what and where how to process (visualise, analyse, etc) the data: ncdump, python, ferret, ...
MIP data on marble : what ??? data, what? cmip3 (IPCC-AR4) http://www.climatechange2013.org/images/uploads/cover.jpg http://ipcc.ch/report/ar5/wg3/img/wg3cover.png Impacts, Adaptation, and Vulnerability cmip5 (IPCC-AR5) cmip5_25x25 MIP == Model Intercomparision Project The homepage of the Coupled Model Intercomparison Project (CMIP). Here you find links to CMIP Phase 3 (CMIP3) and CMIP Phase 5 (CMIP5). Recommended is the Guide to CMIP5 where you find also links to other MIPs like GeoMIP.
MIP data on marble : where ??? data, where? data_dir=/data/marble CMIP3: data_dir/cmip3/IPCC_AR4/list (list with (soon) available data) CMIP5: data_dir/cmip5/experiment/temporal-resolution/variable/model/realisation/*.nc CMIP5_25x25: same like cmip5; 25 25 indicates the regular horizontal grid of 2.5 2.5 deg GeoMIP: data_dir/GeoMIP/experiment/temporal-resolution/mon/variable /institution/model/realisation/*.nc
MIP data on marble : what and where ??? data_dir/cmip5/experiment/ CMIP5-experiments: piControl, rcp26, rcp45, rcp60, rcp85, historical, historicalExt, historicalGHG, historicalMisc, historicalNat, 1pctCO2, abrupt4xCO2, esmFdbk1, esmFixClim2, esmHistorical, esmrcp85, amip GeoMIP-experiments: piControl, rcp45, 1pctCO2, abrupt4xCO2, db, G1, G1oceanAlbedo, G2, G3, G3S, G4, G4cdnc, G5 data_dir/cmip5/experiment/temporal-resolution/ As temporal resolution we have at our disposal: monthly data from the Atmosphere, Ocean and Land (Amon, Omon and Lmon) and fixed data (fx) containing e.g. area (areacello) and volume (volcello) information about the model. data_dir/cmip5/experiment/temporal-resolution/variable/ e.g. ~$ ls /data/marble/cmip5/piControl/Omon: fgco2 hfds so thetao tos zos zostoga e.g. ~$ ls /data/marble/GeoMIP/piControl/Amon/mon: cSoil lai pr ra rsdt so tasmax thetao ts gpp orog prsn rlut rsut tas tasmin tos zos Two useful pdf-files about the model experiments and variables: experiment controlled vocabulary and standard_output. The latter is quite comprehensive and is reduced to our available variables (based on the pre-industrial control experiment (piControl)): standard_output_red.xlsx (this list also holds for our GeoMIP data).
MIP data on marble : what and where ??? data_dir/cmip5/experiment/temporal-resolution/variable/model/ e.g. $ ls /data/marble/cmip5/piControl/Amon/ts: ACCESS1-0 CESM1-CAM5-1-FV2 FGOALS-g2 GISS-E2-R-CC MIROC5 ACCESS1-3 CESM1-FASTCHEM FGOALS-s2 HadGEM2-AO MIROC-ESM bcc-csm1-1 CESM1-WACCM FIO-ESM HadGEM2-CC MIROC-ESM-CHEM bcc-csm1-1-m CMCC-CESM GFDL-CM3 HadGEM2-ES MPI-ESM-LR BNU-ESM CMCC-CM GFDL-ESM2G inmcm4 MPI-ESM-MR CanESM2 CMCC-CMS GFDL-ESM2M IPSL-CM5A-LR MPI-ESM-P CCSM4 CNRM-CM5 GISS-E2-H IPSL-CM5A-MR MRI-CGCM3 CESM1-BGC CNRM-CM5-2 GISS-E2-H-CC IPSL-CM5B-LR NorESM1-M CESM1-CAM5 CSIRO-Mk3-6-0 GISS-E2-R MIROC4h NorESM1-ME CMIP5_modeling_groups.pdf data_dir/cmip5/experiment/temporal-resolution/variable/model/realisation/*.nc e.g. $ ls /data/marble/cmip5/historical/Omon/zostoga/ACCESS1-3: r1i1p1 r2i1p1 r3i1p1 (you always can check the availability of data with e.g. 'ls /data/marble/cmip5/* > out.dat')
MIP data on marble : what and where ??? example file (3d, x,y,t) time series at each areal grid-point cd /data/marble/cmip5/rcp85/Omon/hfds/ACCESS1-0/r1i1p1 ~$ ls -> hfds_Omon_ACCESS1-0_rcp85_r1i1p1_200601-210012.nc example file (4d, x,y,z,t) time series at each volumetric grid point cd /data/marble/cmip5/rcp85/Omon/thetao/ACCESS1-0/r1i1p1 ~$ ls -> thetao_Omon_ACCESS1-0_rcp85_r1i1p1_200601-201012.nc thetao_Omon_ACCESS1-0_rcp85_r1i1p1_201101-201512.nc ...
MIP data on marble ... some plots ... 1/ hfds_Omon_ACCESS1-0_rcp85_200601_210012.nc 2/ hfds_Omon_ACCESS1-0_rcp85_200601_210012.nc 3/ thetao_Omon_ACCESS1-0_historical_r1i1p1_200001_200412.nc 4/ zostoga_Omon_ACCESS1-0_historical_r1i1p1_185001-200512.nc
MIP data on marble : netcdf ??? netCDF: network Common Data Form info faq meta-data: ~$ ncdump h file_name example: ~$ ncdump h /data/marble/cmip5/rcp45/Omon/zostoga/ACCESS1-0/r1i1p1/zostoga_Omon_ACCESS1-0_rcp45_r1i1p1_200601-210012.nc netcdf zostoga_Omon_ACCESS1-0_rcp45_r1i1p1_200601-210012 { dimensions: time = UNLIMITED ; // (1140 currently) bnds = 2 ; variables: double time(time) ; double time_bnds(time, bnds) ; float zostoga(time) ; raw-data: ~$ ncdump v variable_name file_name time:bounds = "time_bnds" ; time:units = "days since 0001-01-01" ; zostoga:standard_name = "global_average_thermosteric_sea_level_change" ; example: ~$ ncdump vzostoga /data/marble/cmip5/rcp45/Omon/zostoga/ACCESS1-0/r1i1p1/ostoga_Omon_ACCESS1-0_rcp45_r1i1p1_200601-210012.nc zostoga = 0.05949634, 0.06122969, 0.06356658, 0.06492361, 0.06417097, 0.06184246, 0.05911458, 0.05761012, ....
MIP data on marble : netcdf ??? first visualisation step: ~$ ncview file_name e.g. ~$ ncview /data/marble/GeoMIP/piControl/Amon/mon/ra/NASA-GISS/ GISS-E2-R/r1i1p1/ra_Lmon_GISS-E2-R_piControl_r1i1p1_185001-191912.nc netcdf_software panoply
MIP data on marble : ferret ??? What data means without proper visualization? Unprocessed data is bunch of jargon to many. Cleansing can make it edible. And yes, not everyone is a data scientist: data visualization with ferret ferret_users_guide start ferret: ~$ ferret -nojnl load data: yes? use "file_dir/file_name show data: yes? sh variable_name plot data[1d]: yes? plot variable_name shade data[2d]: yes? shade variable_name[i=,j=,z=,t=] make (non-weighted) averages: yes? variable_name[i=@ave]
MIP data on marble : ferret ??? ferret examples for shading, plot a time series and profile plot and how to remove the seasonal climatology (/home/UNIMELB/kdommenget/ferret_scripts/examples) 1/ shading_tave_ex.jnl, 2/ plot_tseries_aave_ex.jnl, 3/ plot_tave_profile_ex.jnl, 4/ rem_seasonal_clim_ex.jnl 1/ shading_tave_ex.jnl 2/ plot_tseries_ex.jnl 3/ plot_tave_profile_ex.jnl 4/ rem_seasonal_clim_ex.jnl ca da/all ca da/all ca var/all ca da/all ca var/all ca da/all ca var/all ca da/all ca var/all !""" plots your monthly time series, based on: """ !""" usage go plot_tseries_ex.jnl dir file_name var_name tb te """ !""" plots profile from your monthly time series, based on: """ !""" usage go plot_tave_profile.jnl dir file_name var_name tb te """ !""" removes seasonal climatology (climatological annual cycle) from your monthly time series, based on: """ !""" http://ferret.pmel.noaa.gov/static/FAQ/analysis/climatologies.html """ !""" usage go remove_seasonal_clim.jnl dir file_name var_name tb te """ !""" contours/shades from your monthly time series, based on: """ !""" usage go shade_tave_ex.jnl dir file_name var_name tb te """ !dir = /data/marble/cmip5/rcp85/Omon/hfds/ACCESS1-0/r1i1p1 !file_name = hfds_Omon_ACCESS1-0_rcp85_r1i1p1_200601- 210012.nc !var_name = hfds !tb = 2006 !te = 2100 !dir = /data/marble/cmip5/historical/Omon/thetao/ACCESS1- 0/r1i1p1 !file_name = thetao_Omon_ACCESS1-0_thetao_r1i1p1_185001- 200512.nc !var_name = thetao !tb = 2000 !te = 2004 !dir = /data/marble/cmip5/rcp85/Omon/hfds/ACCESS1-0/r1i1p1 !file_name = hfds_Omon_ACCESS1-0_rcp85_r1i1p1_200601- 210012.nc !var_name = hfds !tb = 2006 !te = 2100 !dir = /data/marble/cmip5/historical/Omon/zostoga/ACCESS1-0/r1i1p1 !file_name = zostoga_Omon_ACCESS1-0_historical_r1i1p1_185001- 200512.nc !var_name = zostoga !tb = 1850 !te = 2005 define symb dir = $1 define symb file_name = $2 define symb var_name = $3 define symb te = $4 define symb tb = $5 define symb dir = $1 define symb file_name = $2 define symb var_name = $3 define symb te = $4 define symb tb = $5 define symb dir = $1 define symb file_name = $2 define symb var_name = $3 define symb te = $4 define symb tb = $5 define symb dir = $1 define symb file_name = $2 define symb var_name = $3 define symb te = $4 define symb tb = $5 !""" example data set: monthly downward heat flux at sea water surface (in W/m**2) """ !""" comment: this is the net heat entering the liquid water column through its upper surface. """ use "($dir)/($file_name)" !""" example data set: monthly downward heat flux at sea water surface (in W/m**2) """ !""" comment: this is the net heat entering the liquid water column through its upper surface. """ use "($dir)/($file_name)" !""" example data set: monthly potential temperature (in K) """ use "($dir)/($file_name)" !""" example data set: monthly global mean thermosteric sea level """ use "($dir)/($file_name)" !""" (optional) set the time range of data "" define axis/calendar=gregorian/t="15-jan-($tb)":"15-dec- ($te)":1/unit=months tmon let var_name_of_interest = ($var_name)[gt=tmon@asn] !""" (optional) set the time range of data "" let var_name_of_interest = ($var_name)[gt=tmon@asn] !""" get the climatological axis that you want to use """ !""" here we will use the pre-defined axis ("month-reg") """ !""" (optional) set the time range of data "" efine axis/calendar=gregorian/t="15-jan-($tb)":"15-dec- ($te)":1/unit=months tmon let var_name_of_interest = ($var_name)[gt=tmon@asn] !""" plot variable """ let/title="global mean" var_gm=var_name_of_interest[i=@ave,j=@ave,l=@shn:23] let/title="cold tongue" var_ct=var_name_of_interest[i=150,j=150,l=@shn:23] let/title="Labrador Sea" var_ls=var_name_of_interest[i=225,j=230,l=@shn:23] !""" define depths levels """ let zz = z[gz=var_name_of_interest] define axis/z/units=m/depth zlevn = zz use climatological_axes cancel data climatological_axes !""" compute the temporal mean """ let var_name_ave = var_name_of_interest[l=@ave] !""" (optional) set the time range of data to be used in the climatology """ define axis/calendar=gregorian/t="15-jan-($tb)":"15-dec- ($te)":1/unit=months tmon let var_name_of_interest = ($var_name)[gt=tmon@asn] !""" plot variable """ let/title='global mean' var_gm=var_name_of_interest[i=@ave,j=@ave,l=25:36@ave,gz=zle vn@asn]-273.15 let/title='cold tongue' var_ct=var_name_of_interest[i=150,j=150,l=@ave,gz=zlevn@asn]- 273.15 let/title='Labrador Sea' var_ls=var_name_of_interest[i=225,j=230,l=@ave,gz=zlevn@asn]- 273.15 !""" contour/shade variable """ shade/lev="(-inf)(-100,100,20)(inf)" var_name_ave, lon, lat plot var_gm, var_ct, var_ls !""" compute the climatology """ let var_name_climatology = var_name_of_interest[gt=month_reg@mod] !""" save file """ frame/file=test.gif sp convert test.gif shade_tave_ex.pdf sp \rm test.gif] !""" save file """ frame/file=test.gif sp convert test.gif plot_tseries_ex.pdf sp \rm test.gif !""" subtract to get the anomaly """ !""" regrid the anomaly back to the original time axis using @asn to guarantee success """ !""" (subtle interpolation errors may occur on irregular time axes if the @asn regridding isn't done.) """ plot var_gm, var_ct, var_ls !""" save file """ frame/file=test.gif sp convert test.gif plot_tave_profile.pdf sp \rm test.gif let var_name_anomaly = var_name_of_interest - var_name_climatology[gt=var_name_of_interest@asn] plot var_name_anomaly[gt=var_name_of_interest@asn] plot/ov var_name_of_interest plot/ov var_name_climatology[gt=var_name_of_interest@asn]
MIP data on marble : ferret ??? resulting plots ... 1/ shading_tave_ex.jnl 2/ plot_tseries_aave_ex.jnl 3/ plot_tave_profile_ex.jnl 4/ rem_seasonal_clim_ex.jnl where to find ferret examples and demo-scripts? /data/marble/fer_dsets/data /usr/local/ferret/examples (in ferret: go example_file.jnl)
MIP data on marble : python ??? python faq stackoverflow a python tutorial for climate scientist (by ARC-CCS center of excellence in climate system science) a netcdf data reading routine with python (>2.7) (readnetcdf_example.py): main file: ## this is an example for the header of the main program import scipy.io.netcdf as spn import glob from cmip5_rd import * ## read netcdf-data and process further with a1.keys() and look at the key-variables with a1['var'][:] or firstly, to get the shape: a1['var'].shape a1 = rdnetcdfdata('filename_as_string') subroutine: ## this could be subroutine "cmip5_rd.py" import scipy.io.netcdf as sp def rdnetcdfdata(filename): """reads netcdf-data: output is a dictionary process further with keys etc """ fobj = sp.netcdf_file(filename, mode='r') outputarray = fobj.variables fobj.close() return outputarray
MIP data on marble : python ??? some plots ... example files in /home/UNIMELB/kdommenget/python_scripts read_and_write_netcdf_files: examples for a variety of programming languages including python and matlab.
MIP data on marble What is the difference between Data, Presentation, Information and Knowledge? 25 Cartoons To Give Current Big Data Hype A Perspective
