Understanding Just in Time Production and JIT Principles
Explore the concepts of Just in Time Production (JIT), Gantt charts, and flow charts in manufacturing, with a focus on reducing stock levels and costs. Learn about the key components of JIT, such as good supplier relationships, efficient planning, and Kanban systems. Discover how JIT streamlines production processes and minimizes wastage.

Download Presentation

Please find below an Image/Link to download the presentation.
The content on the website is provided AS IS for your information and personal use only. It may not be sold, licensed, or shared on other websites without obtaining consent from the author. If you encounter any issues during the download, it is possible that the publisher has removed the file from their server.
You are allowed to download the files provided on this website for personal or commercial use, subject to the condition that they are used lawfully. All files are the property of their respective owners.
The content on the website is provided AS IS for your information and personal use only. It may not be sold, licensed, or shared on other websites without obtaining consent from the author.
E N D
Presentation Transcript
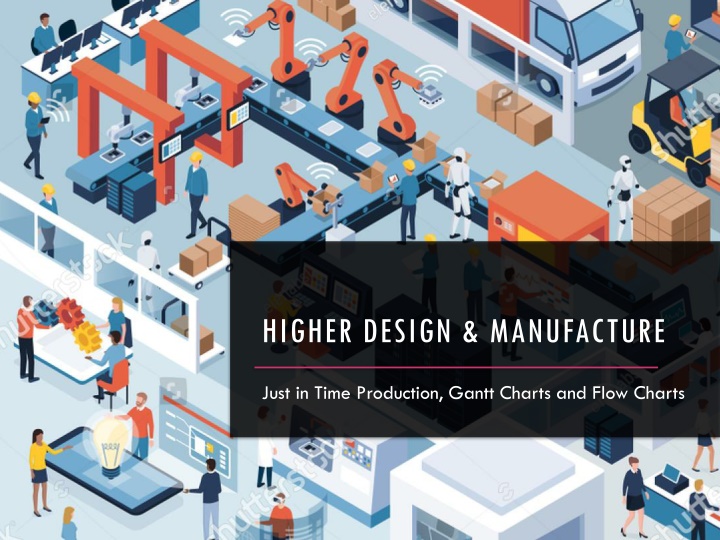
HIGHER DESIGN & MANUFACTURE Just in Time Production, Gantt Charts and Flow Charts
LEARNING INTENTIONS & SUCCESS CRITERIA Learning Intentions Overview of Just in Time Production Overview of the use of gantt and flow charts Success Criteria Describe and explain what is meant by Just in Time Production Explain and create a gantt and flow chart
Just in Time Production was first pioneered by the Japanese to reduce stock levels and reduce cost. JUST IN TIME PRODUCTION (JIT) Products are made quickly and in the exact quantities needed to meet demand. Materials arrive ready for use exactly when they are needed. This means; Companies have less capital (money) tied up in raw materials Carry less stock and therefore require less storage space There are no stockpiles of finished goods waiting to be dispatched.
JIT requires: Good relationships between manufacturers and suppliers. JIT Suppliers will have to be flexible and respond immediately to the manufacturers demands. Manufacturers must plan carefully, having accurate estimates for each stage and efficient stock control systems.
To help JIT Production to run smoothly, a Kanban (request) system is normally used, which controls material flow. KANBAN If a Kanban is set at 100, then a maximum of 100 components can be placed there at one time. However, if all 100 parts are used then there will be no stock available to continue production. Therefore a minimum level must be set to signal when stock needs to be replenished. This visual signalling of stock levels reduces paperwork and ensures all keep an eye on the stock levels.
The Kanban on the next slide shows 2 assemblies; The first is a nut and bolt The second is putting these into a box KANBAN When the minimum is reached of any of the 3 products, it should be restocked before it runs out and production has to stop. Min = 25 Min = 25 Max = 100 Max = 100 Min = 25 Nut Bolt Max = 100 Assembly Box Quality control has been built in with a Kanban of 10 being set. Nut and Bolt Assembly Final Assembly Assembly Distribute This means that if a batch is found to be defective in anyway it is only 10 need to be repaired or recycled. Kanban = 10
KANBAN Min = 25 Min = 25 Max = 100 Max = 100 Min = 25 Bolt Nut Max = 100 Assembly 1 Box Nut and Bolt Assembly Final Assembly Assembly 2 Distribute Kanban = 10
When the delivery of parts is not reliable. WHEN DOES JIT NOT WORK? When the distance between the supplier and factory is too great. When the quality of parts is not guaranteed. When production is unstable. When stock control is inefficient and poorly planned.
The goal of JIT system is to achieve: Zero Stock Zero Lead Time (the time taken between an order being placed and delivery) Zero Defects Zero Breakdowns Zero Paperwork GOALS OF JIT These Five Zeros are almost impossible to achieve but they are targets to aim at. Companies will carry a small amount stock, enough for a few days production just in case.
Just in Time production is used by car manufacturers to reduce costs. PAST PAPER QUESTION 2007 Q5 With reference to car manufacture, describe Just in Time production. (3 marks) TIPS: Think about the demand Are parts produced by other companies/sub-contractors? Think about materials Think about cost
JIT involved reducing stock levels within a factory to reduce costs. Car manufacturers would identify exact quantities needed to meet customer demand. Many parts and materials are delivered by sub-contracting at the critical time required by the car manufacturer. Production materials are delivered when and where they are needed according to the car manufactures plan of production Therefore less capital is tied up in raw materials and less space is required to store materials and components. ANSWER
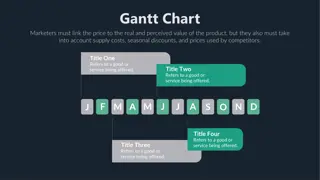
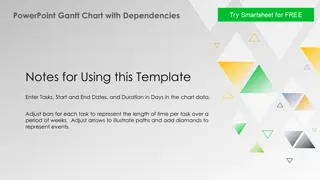
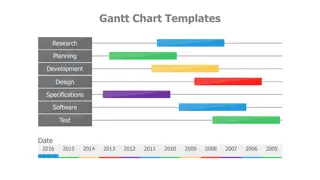
Purpose: Gantt charts are used to visually plan and allocate time to tasks which are required to be completed as part of the a project. PLANNING WITH GANTT CHARTS Each individual task is given a start date and deadline for completion. These charts allow those who are in charge of the projects to track the progress of the project ensuring that all tasks are completed on time. Gantt charts also show the sequence of tasks, the dependency of one task on another and what tasks can be undertaken concurrently. You can also work out from the Gantt chart what type of workforce are needed and may show conginency plans if a tasks are not completed on schedule.
Audience: Project Managers Lead Designer Manufacturing Engineering Quantity Surveyor PLANNING GANTT CHARTS
Benefits: PLANNING GANTT CHARTS This visual method helps users to understand the length of time each task has in proportion to the other tasks. It also helps to: Minimise down time Work out man power requirements Produce sequence of tasks and make contingency plans
Purpose: The flowchart shows the steps as boxes of various kinds, and their order by connecting the boxes with arrows. FLOW CHARTS This diagrammatic representation illustrates a solution model to a given problem. Flowcharts are used in analysing, designing, documenting or managing a process or program in various fields.
Audience: Manufacturing Engineering, field engineers, technicians etc. FLOW CHARTS
Benefits: This visual method helps users to understand the steps that can be taken to correct a problem. It also helps to minimise down time and work out possible problems and solutions. FLOW CHARTS