Understanding Bayesian Model Comparison in Neuroimaging Research
Exploring the process of testing hypotheses using Statistical Parametric Mapping (SPM) and Dynamic Causal Modeling (DCM) in neuroimaging research. The journey from hypothesis formulation to Bayesian model comparison, emphasizing the importance of structured steps and empirical science for successful outcomes. Key concepts include hypothesis generation, experimental design, data collection, brain localization, model comparison, and predictive validity assessment.
Download Presentation

Please find below an Image/Link to download the presentation.
The content on the website is provided AS IS for your information and personal use only. It may not be sold, licensed, or shared on other websites without obtaining consent from the author. Download presentation by click this link. If you encounter any issues during the download, it is possible that the publisher has removed the file from their server.
E N D
Presentation Transcript
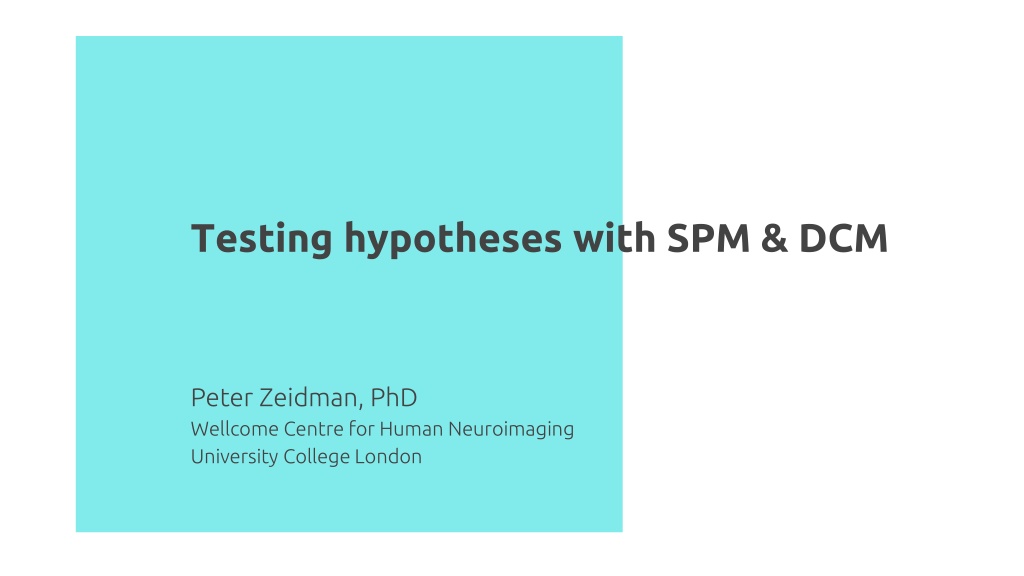
Testing hypotheses with SPM & DCM Peter Zeidman, PhD Wellcome Centre for Human Neuroimaging University College London
Inverse problems Image credits: Pekachu, Anastasiia Starikova, Kelvinsong from Wikipedia
Empirical science Bayesian model comparison ?1 ?2 Which hypothesis (model) offers the best explanation for my data? Model evidence (marginal likelihood) Likelihood ratio (Bayes factor) ? ? ?1 ? ? ?2 Stephan et al., NeuroImage, 2008
Eight steps to DCM for fMRI success 1. 2. 3. 4. 5. 6. 7. 8. Write down some hypotheses Design an experiment Data collection and pre-processing Functional localisation First-level DCM Group analysis using Parametric Empirical Bayes (PEB) Bayesian model comparison Assess predictive validity 9. 10. (Nobel Prize) (Write the paper)
1. Write down some hypotheses DCM is a tool for scoring the evidence for different hypotheses. It is not an exploratory technique. Commonalities Differences I hypothesise that top-down connections from parietal cortex are modulated by attention to visual stimuli. I hypothesise that people with a diagnosis of Mild Cognitive Impairment (MCI) have weaker modulation of top-down connections by attention.
1. Write down some hypotheses One hypothesis one model One hypothesis one family of models A model space Family 1 Family 2
1. Write down some hypotheses Drawing a diagram for each hypothesis can help!
Eight steps to DCM success 1. Write down some hypotheses 2. Design an experiment 3. Data collection and pre-processing 4. Functional localisation 5. First-level DCM 6. Group analysis using Parametric Empirical Bayes (PEB) 7. Bayesian model comparison 8. Assess predictive validity
2. Design an experiment Use a factorial design where possible e.g. [2 x 2] design: Factor 1: Factor 1: faces or upside down faces Factor 2: Factor 2: attend to emotion or attend to hair colour FFA Factor 1: faces (driving) V1 Factor 2: emotion (modulating)
2. Design an experiment Favour controlled tasks over resting state where possible Rest is great when There s a DCM for that Participants cannot perform tasks Use DCM for cross-spectral densities (Spectral DCM) You are interested in resting state brain dynamics Studies often have a factorial design at the between- subjects level (e.g. two groups, pre- and post-intervention) Any others? Friston, K.J., Kahan, J., Biswal, B. and Razi, A., 2014. A DCM for resting state fMRI. Neuroimage, 94, pp.396-407.
Resting state example Model space Are visual hallucinations in Parkinson s disease explained by impaired bottom-up integration of sensory information and overweighting of top-down perceptual priors within the visual system? Participants: 15 Parkinson s disease visual hallucinators 75 Parkinson s disease non-visual hallucinators. Thomas, G.E., et al., 2023. Brain Communications, 5(1)
Resting state example Thomas, G.E., et al., 2023. Brain Communications, 5(1)
2. Design an experiment Favour controlled tasks over resting state where possible Rest is great when There s a DCM for that Participants cannot perform tasks Use DCM for cross-spectral densities (Spectral DCM) You are interested in resting state brain dynamics Studies often have a factorial design at the between- subjects level (e.g. two groups, pre- and post-intervention) Any others? Friston, K.J., Kahan, J., Biswal, B. and Razi, A., 2014. A DCM for resting state fMRI. Neuroimage, 94, pp.396-407.
Eight steps to DCM success 1. Write down some hypotheses 2. Design an experiment 3. Data collection and pre-processing 4. Functional localisation 5. First-level DCM 6. Group analysis using Parametric Empirical Bayes (PEB) 7. Bayesian model comparison 8. Assess predictive validity
3. Data collection and pre-processing No special considerations for DCM Dynamic Causal Modelling (DCM) Timeseries extraction from Regions of Interest (ROIs) Image pre- processing (realignment, co- registration, normalisation, smoothing) Statistical Parameter Mapping (SPM) / General Linear Model Functional MRI acquisition and image reconstruction DCM
Eight steps to DCM success 1. Write down some hypotheses 2. Design an experiment 3. Data collection and pre-processing 4. Functional localisation 5. First-level DCM 6. Group analysis using Parametric Empirical Bayes (PEB) 7. Bayesian model comparison 8. Assess predictive validity
4. Functional localisation A network consists of nodes (brain regions) and connections. We need to select the nodes. Task based experiments Resting state experiments The purpose of DCM is to infer the underlying neural connectivity that gave rise to your SPM results. The purpose of DCM is to infer the underlying neural connectivity that caused the functional connectivity (correlations or cross- spectral density) among pre- selected brain regions. Select Regions of Interest using your contrasts Select Regions of Interest from Select Regions of Interest from previous literature, anatomical previous literature, anatomical hypotheses or an initial PCA or ICA hypotheses or an initial PCA or ICA
Eight steps to DCM success 1. Write down some hypotheses 2. Design an experiment 3. Data collection and pre-processing 4. Functional localisation 5. First-level DCM 6. Group analysis using Parametric Empirical Bayes (PEB) 7. Bayesian model comparison 8. Assess predictive validity
5. First level DCM Two outputs: Free energy Estimated parameters Approximation of the log model evidence ? ?|? Posterior (multivariate Gaussian) probability ? ?|?,? ? log? ?|? = accuracy complexity
5. First level DCM Check the variance explained by your models (10% or more is considered non-trivial) spm_dcm_fmri_check(DCM);
Eight steps to DCM success 1. Write down some hypotheses 2. Design an experiment 3. Data collection and pre-processing 4. Functional localisation 5. First-level DCM 6. Group analysis using Parametric Empirical Bayes (PEB) 7. Bayesian model comparison 8. Assess predictive validity
6. Group analysis using Parametric Empirical Bayes (PEB) Group-level questions: Are the strength of particular connections changed by an experimental manipulation? Does belonging to a diagnostic group of these connections? Does the strength of the connections correlate with behavioural or clinical variables behavioural or clinical variables? Could we predict predict a new participant s disease status or behavioural scores using our estimate of their connections? group determine the strength
6. Group analysis using Parametric Empirical Bayes (PEB) The connectivity parameters are taken to the group level and modelled using a General Linear Model Design matrix (covariates) Group level parameters Outputs: Unexplained between- subject variability Group average connection strength One free energy for the entire group-level model (DCMs and GLM). ?(1)= ??(2)+ ?(2) ?(1) ?(2) ? Subject1 Group-level parameters (effect of each covariate on each connection) 2 3 4 5 6 Subject Effect of group on the connection = Effect of age on the connection 1 2 3 Covariate
Eight steps to DCM success 1. Write down some hypotheses 2. Design an experiment 3. Data collection and pre-processing 4. Functional localisation 5. First-level DCM 6. Group analysis using Parametric Empirical Bayes (PEB) 7. Bayesian model comparison 8. Assess predictive validity
7. Bayesian model comparison PEB model 1 PEB model 2 Design matrix Design matrix Subject Subject Without age covariate With age covariate 1 2 1 2 3 Covariate Covariate (The free energy for nested models is derived analytically using Bayesian Model Reduction) Free energy ?1 Free energy ?2 log?? = ?1 ?2
Bayesian model reduction Pre-defined models Automatic search Friston, Parr, Zeidman. Bayesian model reduction. arXiv preprint arXiv:1805.07092.
Eight steps to DCM success 1. Write down some hypotheses 2. Design an experiment 3. Data collection and pre-processing 4. Functional localisation 5. First-level DCM 6. Group analysis using Parametric Empirical Bayes (PEB) 7. Bayesian model comparison 8. Assess predictive validity
8. Assess predictive validity The question Predicted vs actual covariates corr(df:22) = 0.95: p < 0.000 Are the effect sizes I detected large enough to predict the group membership or clinical scores of new new participants? 0.5 0.4 0.3 Estimate 0.2 Leave-one-out (LOO) cross- validation 0.1 0 -0.1 0 1 group effect
Eight steps to DCM success 1. Write down some hypotheses 2. Design an experiment 3. Data collection and pre-processing 4. Functional localisation 5. First-level DCM 6. Group analysis using Parametric Empirical Bayes (PEB) 7. Bayesian model comparison 8. Assess predictive validity
The ageing brain: ipsilateral M1 Subjects clustered into groups by rM1 response Main effect of age BOLD N=635 participants aged 18 88 (Cam-CAN) Age (years) Tak, Y.W., Knights, E., Henson, R. and Zeidman, P., 2021. Ageing and the ipsilateral M1 BOLD response: a connectivity study. Brain sciences,11(9), p.1130.
The ageing brain: DCM Dynamic Causal Modelling (DCM) for fMRI Neural model Haemodynamic Model i. Cerebral blood flow (rCBF) ii. Venous Balloon iii. BOLD signal ??,? ?? volume ? ? BOLD signal ? flow ??? activity ?(?) signal ? ??,? ??,?0,?0,??,?0 dHb ? ? ??,?0 Friston et al. 2000 Buxton et al. 1998 Stephan et al. 2007 Tak, Y.W., Knights, E., Henson, R. and Zeidman, P., 2021. Ageing and the ipsilateral M1 BOLD response: a connectivity study. Brain sciences,11(9), p.1130.
The ageing brain: model structure 1 Modelled rM1 BOLD L R SMA SMA 0.5 PMd M1 0 PMd PMd -0.5 0 10 20 M1 M1 SMA Time (s) The model successfully captured the difference in the right M1 BOLD response between younger and older responders. Tak, Y.W., Knights, E., Henson, R. and Zeidman, P., 2021. Ageing and the ipsilateral M1 BOLD response: a connectivity study. Brain sciences,11(9), p.1130.
The ageing brain: model parameters In silico experiment Younger subjects Older subjects lPMd rM1 1 SMA SMA SMA SMA +1Hz 0.5 BOLD PMd PMd PMd PMd 0 0.17Hz 0.73Hz -0.13Hz 0.47Hz -1Hz M1 M1 M1 M1 -0.5 -0.12Hz -0.43Hz 0 5 10 15 20 25 Time (secs) Positive connection Negative connection Increasing lSMA rM1, lPMd rM1 or lM1 rM1 connection strengths in silico could flip the sign of the BOLD response, mirroring the ageing process. Tak, Y.W., Knights, E., Henson, R. and Zeidman, P., 2021. Ageing and the ipsilateral M1 BOLD response: a connectivity study. Brain sciences,11(9), p.1130.
The ageing brain: cross-validation Only the lSMA rM1 and lPMd rM1 connections correlated with rM1 BOLD across subjects. Total variance explained: 44% Tak, Y.W., Knights, E., Henson, R. and Zeidman, P., 2021. Ageing and the ipsilateral M1 BOLD response: a connectivity study. Brain sciences,11(9), p.1130.
Eight steps to DCM success 1. Write down some hypotheses 2. Design an experiment 3. Data collection and pre-processing 4. Functional localisation 5. First-level DCM 6. Group analysis using Parametric Empirical Bayes (PEB) 7. Bayesian model comparison 8. Assess predictive validity
Further reading Tutorial papers: Tutorial papers: Zeidman, P., Jafarian, A., Corbin, N., Seghier, M.L., Razi, A., Price, C.J., Friston, K.J. A guide to group effective A guide to group effective connectivity analysis, part 1: First level analysis with connectivity analysis, part 1: First level analysis with DCM for fMRI DCM for fMRI. NeuroImage, 200, pp. 174-190. 2019. What I cannot create I do not understand. . Zeidman, P., Jafarian, A., Seghier, M.L., Litvak, V., Cagnan, H., Price, C.J., Friston, K.J. A guide to group effective A guide to group effective connectivity analysis, part 2: Second level analysis with connectivity analysis, part 2: Second level analysis with PEB. PEB. NeuroImage, 200, pp. 12-25. 2019. Richard Feynman Technical papers: Technical papers: Friston, K., Parr, T. and Zeidman, P., 2018. Bayesian model reduction reduction. arXiv:1805.07092. Friston, K.J., Litvak, V., Oswal, A., Razi, A., Stephan, K.E., Van Wijk, B.C., Ziegler, G. and Zeidman, P., 2016. Bayesian model reduction and empirical Bayes for Bayesian model reduction and empirical Bayes for group (DCM) studies group (DCM) studies. Neuroimage, 128, pp.413-431. Zeidman, P., Friston, K. and Parr, T., 2022. A primer on Variational Laplace Variational Laplace. https://doi.org/10.31219/osf. Bayesian model A primer on
