Transportation Engineering
 undefined


Transportation Engineering


Traffic Characteristics: Examples
Q
u
e
s
t
i
o
n
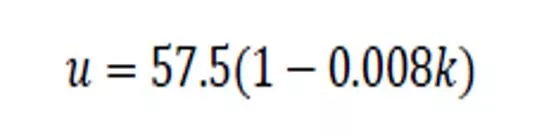
A study of freeway flow at a particular site has resulted in the
following speed-density relationship as follows:
Where u in units of mi/hr and k in unit of veh/mi
For this relationship, determine: (a) the free-flow speed, (b)
jam density, (c) the speed-flow relationship, (d) the flow-
density relationship, and (e) maximum flow (i.e. capacity).
Traffic Characteristics: Examples
Solution
The general speed-density relationship is:
The relationship in the question
could be re-written as follows:
Therefore,
a. The free flow speed= uf=57.5 (mi/hr)
b. The jam density =kj,
uf/kj=0.46
……..> kj=57.5/0.46=125 veh/mi
Traffic Characteristics: Examples
Solution
c. The speed-flow relationship
The general equation is:
By substituting kj=125 and uf=57.5 produce:
o
r
:
Traffic Characteristics: Examples
Solution
o
r
:
then by substituting k=q/u produces:
Traffic Characteristics: Examples
Solution
d. The flow-density relationship
The general equation is:
By substituting kj=125 and uf=57.5 produce:
o
r
then by multiplying by k produces:
Traffic Characteristics: Examples
Solution
d. The maximum flow qmax
Traffic Characteristics: Examples
Q
u
e
s
t
i
o
n
Two sets of vehicles are timed over a kilometer section long
and flows are also recorded. In the first set, four vehicles take
53, 56, 63 and 69 seconds when the flow is 1500 veh/hr. In
the second set, four vehicles take 70, 74, 77 and 79 seconds
when the flow is 1900 veh/hr.
1- Estimate the capacity (maximum flow) of a section.
2- Estimate average speed and density at flow rate of 800
veh/hr.
3- If the average speed of traffic is 60km/hr, state the traffic
condition (i.e. normal or congested)?
Traffic Characteristics: Examples
S
o
l
u
t
i
o
n
Two sets of vehicles are timed over a kilometer section long and flows are
also recorded. In the first set, four vehicles take 53, 56, 63 and 69 seconds
when the flow is 1500 veh/hr. In the second set, four vehicles take 70, 74,
77 and 79 seconds when the flow is 1900 veh/hr.
Traffic Characteristics: Examples
Solution
1. Estimating the capacity (qmax) of a section
a.
Estimation of space mean speed for set 1:
Density for set 1=q/us
=1500/59.75=25.1 veh/km
Traffic Characteristics: Examples
Solution
1. Estimating the capacity (qmax) of a section
b. Estimation of space mean speed for set 2:
Density for set 2=q/us
=1900/48=39.6 veh/km
Traffic Characteristics: Examples
Solution
1. Estimating the capacity (qmax) of a section
c.
By using the fundamental equation of speed-density relationship:
using data set 1:
using data set 2 :
---(2)
Traffic Characteristics: Examples
Solution
1. Estimating the capacity (qmax) of a section
Eq(1)-Eq(2) produces:
---(2)
Traffic Characteristics: Examples
Solution
1. Estimating the capacity (qmax) of a section
Substitute eq(3) in eq(1) produces:
Traffic Characteristics: Examples
Solution
2. Average speed and density at flow rates of 800 and 2000
veh/hr.
a. Speed at flow of 800 veh/hr
1.234u2 - 98.72u + 800 = 0
A=1.234, B= -98.72, C=800
Traffic Characteristics: Examples
Solution
2. Average speed and density at flow rates of 800 and 2000
veh/hr.
a. Speed at flow of 800 veh/hr
A=1.234, B= -98.72, C=800
u=70.85 at normal flow condition
and
u=9.15 at congested flow condition
Solution
2. Average speed and density at flow rates of 800 and 2000
veh/hr.
b. Density at flow of 800 veh/hr
k=q/u
k= 800/70.85=11.29 veh/km
k= 800/9.15=87.43 veh/km
at normal flow condition
at congested flow condition
Solution
2. Average speed and density at flow rates of 800
and 2000
veh/hr.
H
W
Solution
3. If the average speed of traffic is 60km/hr, state the traffic
condition (i.e. normal or congested)?
Since the speed of 60km/hr is higher than the speed at
maximum flow of 1974veh/hr,
speed at qmax=uf/2=40km/hr,
then we expect that the traffic condition is normal based on
fundamental diagram of traffic flow (speed-flow diagram)
In this detailed analysis, we explore traffic characteristics in transportation engineering, focusing on speed-density relationships, flow calculations, and capacity estimations for roadway sections. The example scenarios provide insights into free-flow speed, jam density, speed-flow relationships, flow-density relationships, and maximum flow capacity. Additionally, vehicle timing data is used to estimate capacity, average speed, density at various flow rates, and determine traffic conditions based on average speed thresholds.

Download Presentation

Please find below an Image/Link to download the presentation.
The content on the website is provided AS IS for your information and personal use only. It may not be sold, licensed, or shared on other websites without obtaining consent from the author.If you encounter any issues during the download, it is possible that the publisher has removed the file from their server.
You are allowed to download the files provided on this website for personal or commercial use, subject to the condition that they are used lawfully. All files are the property of their respective owners.
The content on the website is provided AS IS for your information and personal use only. It may not be sold, licensed, or shared on other websites without obtaining consent from the author.
E N D
Presentation Transcript
Traffic Characteristics: Examples Traffic Characteristics: Examples Question A study of freeway flow at a particular site has resulted in the following speed-density relationship as follows: Where u in units of mi/hr and k in unit of veh/mi For this relationship, determine: (a) the free-flow speed, (b) jam density, (c) the speed-flow relationship, (d) the flow- density relationship, and (e) maximum flow (i.e. capacity).
Traffic Characteristics: Examples Traffic Characteristics: Examples Solution The general speed-density relationship is: The relationship in the question could be re-written as follows: Therefore, a. The free flow speed= uf=57.5 (mi/hr) uf/kj=0.46 ..> kj=57.5/0.46=125 veh/mi b. The jam density =kj,
Traffic Characteristics: Examples Traffic Characteristics: Examples Solution c. The speed-flow relationship The general equation is: By substituting kj=125 and uf=57.5 produce: or:
Traffic Characteristics: Examples Traffic Characteristics: Examples Solution or: then by substituting k=q/u produces:
Traffic Characteristics: Examples Traffic Characteristics: Examples Solution d. The flow-density relationship The general equation is: By substituting kj=125 and uf=57.5 produce: or then by multiplying by k produces:
Traffic Characteristics: Examples Traffic Characteristics: Examples Solution d. The maximum flow qmax
Traffic Characteristics: Examples Traffic Characteristics: Examples Question Two sets of vehicles are timed over a kilometer section long and flows are also recorded. In the first set, four vehicles take 53, 56, 63 and 69 seconds when the flow is 1500 veh/hr. In the second set, four vehicles take 70, 74, 77 and 79 seconds when the flow is 1900 veh/hr. 1- Estimate the capacity (maximum flow) of a section. 2- Estimate average speed and density at flow rate of 800 veh/hr. 3- If the average speed of traffic is 60km/hr, state the traffic condition (i.e. normal or congested)?
Traffic Characteristics: Examples Traffic Characteristics: Examples Solution Two sets of vehicles are timed over a kilometer section long and flows are also recorded. In the first set, four vehicles take 53, 56, 63 and 69 seconds when the flow is 1500 veh/hr. In the second set, four vehicles take 70, 74, 77 and 79 seconds when the flow is 1900 veh/hr. Vehicle No. 1 2 3 4 1 2 3 4 Passing time (sec) 53 56 63 69 70 74 77 79 Vehicle Set Flow vph X Y 1 1500 1km 2 1900
Traffic Characteristics: Examples Traffic Characteristics: Examples Solution 1. Estimating the capacity (qmax) of a section a. Estimation of space mean speed for set 1: Density for set 1=q/us =1500/59.75=25.1 veh/km
Traffic Characteristics: Examples Traffic Characteristics: Examples Solution 1. Estimating the capacity (qmax) of a section b. Estimation of space mean speed for set 2: Density for set 2=q/us =1900/48=39.6 veh/km
Traffic Characteristics: Examples Traffic Characteristics: Examples Solution 1. Estimating the capacity (qmax) of a section c. By using the fundamental equation of speed-density relationship: using data set 1: using data set 2 : ---(2)
Traffic Characteristics: Examples Traffic Characteristics: Examples Solution 1. Estimating the capacity (qmax) of a section Eq(1)-Eq(2) produces: ---(2)
Traffic Characteristics: Examples Traffic Characteristics: Examples Solution 1. Estimating the capacity (qmax) of a section Substitute eq(3) in eq(1) produces:
Traffic Characteristics: Examples Traffic Characteristics: Examples Solution 2. Average speed and density at flow rates of 800 and 2000 veh/hr. a. Speed at flow of 800 veh/hr 1.234u2 - 98.72u + 800 = 0 A=1.234, B= -98.72, C=800
Traffic Characteristics: Examples Traffic Characteristics: Examples Solution 2. Average speed and density at flow rates of 800 and 2000 veh/hr. a. Speed at flow of 800 veh/hr A=1.234, B= -98.72, C=800 u=70.85 at normal flow condition and u=9.15 at congested flow condition
Solution 2. Average speed and density at flow rates of 800 and 2000 veh/hr. b. Density at flow of 800 veh/hr k=q/u k= 800/70.85=11.29 veh/km at normal flow condition at congested flow condition k= 800/9.15=87.43 veh/km
Solution 2. Average speed and density at flow rates of 800 and 2000 veh/hr. HW
Solution 3. If the average speed of traffic is 60km/hr, state the traffic condition (i.e. normal or congested)? Since the speed of 60km/hr is higher than the speed at maximum flow of 1974veh/hr, speed at qmax=uf/2=40km/hr, then we expect that the traffic condition is normal based on fundamental diagram of traffic flow (speed-flow diagram)