Tibbles in R Programming
Tibbles are a modern way to work with data frames in R, offering enhanced functionality and ease of use. Learn how to coerce regular data frames to tibbles, their refined printing method, creating tibbles from individual vectors, handling non-syntactic column names, and using tribble for data entry. Explore extracting variables and various operations with tibbles. Enhance your data manipulation skills with tibbles in R.
Download Presentation

Please find below an Image/Link to download the presentation.
The content on the website is provided AS IS for your information and personal use only. It may not be sold, licensed, or shared on other websites without obtaining consent from the author.If you encounter any issues during the download, it is possible that the publisher has removed the file from their server.
You are allowed to download the files provided on this website for personal or commercial use, subject to the condition that they are used lawfully. All files are the property of their respective owners.
The content on the website is provided AS IS for your information and personal use only. It may not be sold, licensed, or shared on other websites without obtaining consent from the author.
E N D
Presentation Transcript
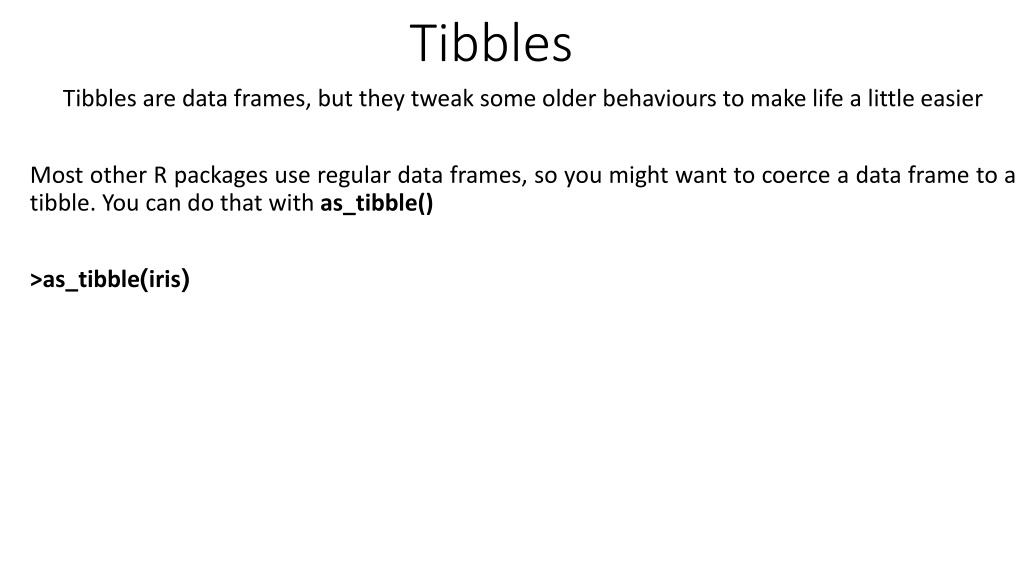
Tibbles Tibbles are data frames, but they tweak some older behaviours to make life a little easier Most other R packages use regular data frames, so you might want to coerce a data frame to a tibble. You can do that with as_tibble() >as_tibble(iris)
Tibbles Tibbles have a refined print method that shows only the first 10 rows, and all the columns that fit on screen. This makes it much easier to work with large data. In addition to its name, each column reports its type >iris > as_tibble(iris) These describe the type of each variable: int stands for integers. dbl stands for doubles, or real numbers. chr stands for character vectors, or strings. dttm stands for date-times (a date + a time). lgl stands for logical, vectors that contain only TRUE or FALSE . fctr stands for factors date stands for dates.
Tibbles You can create a new tibble from individual vectors with tibble(). tibble() will automatically recycle inputs of length 1, you can refer to columns that you ve just created. >tibble( x = 1:5, y = 1, z = x ^ 2 + y ) >data.frame(x = 1:5,y = 1,z = x ^ 2 + y) Error in data.frame(x = 1:5, y = 1, z = x^2 + y) : object 'x' not found
Tibbles It s possible for a tibble to have column names that are not valid R variable names, aka non-syntactic names. For example, they might not start with a letter, or they might contain unusual characters like a space. To refer to these variables, you need to surround them with backticks, ` >tb <- tibble( `:)` = "smile", ` ` = "space", `2000` = "number" )
Tribbles Another way to create a tibble is with tribble() , short for transposed tibble. tribble() is customised for data entry in code: column headings are defined by formulas (i.e. they start with ~ ), and entries are separated by commas. This makes it possible to lay out small amounts of data in easy to read form. > tribble( ~x, ~y, ~z, #--|--|---- "a", 2, 3.6, "b", 1, 8.5 ) >tb <- tribble( ~ `:)`, ~ ` `, ~ `2000`, "smile","space","number" )
Tribbles If you want to pull out a single variable, $ and [[ . [[ can extract by name or position; $ only extracts by name but is a little less typing. > tb<-tibble( x = 1:5, y = 1, z = x ^ 2 + y ) > tb$x >tb[[2]] >tb[[ z ]]
Esercizi Esercizi 1. Caricare gli oggetti creati dall esercizio sui data frame. 2. Creare un oggetto Tibble dal data frame Dmesi. 3. Caricare l oggetto iris e indicarne in una variabile iris_class la classe 4. Caricare l oggetto iris3 e indicarne in una variabile iris_class la classe 5. Creare un oggetto tible di nome t_iris dall oggetto iris 6. Creare un oggetto tible di nome t_iris3 dall oggetto iris3 7. Confronta i seguenti comandi eseguiti su un data frame e su un tibble df <- data.frame(abc = 1, xyz = "a") df$x df[, "xyz"] df[, c("abc", "xyz")]
dplyr package dplyr has three main goals: Identify the most important data manipulation verbs and make them easy to use from R. Provide fast performance for in-memory data by writing key pieces in C++ (using Rcpp) Use the same interface to work with data no matter where it's stored, whether in a data frame, a data table or database.
dplyr package the five key dplyr functions that allow you to solve the vast majority of your data manipulation Pick observations by their values ( filter() ). Reorder the rows ( arrange() ). Pick variables by their names ( select() ). Create new variables with functions of existing variables (mutate() ). Collapse many values down to a single summary ( summarise() ). These can all be used in conjunction with group_by() which changes the scope of each function from operating on the entire dataset to operating on it group-by-group.
Filter rows with filter() filter() allows you to subset observations based on their values. The first argument is the name of the data frame. The second and subsequent arguments are the expressions that filter the data frame. >library(nycflights13) >dim(flights) >filter(flights, month == 1)
Filter rows with filter() Multiple arguments to filter() are combined with and : every expression must be true in order for a row to be included in the output. >library(nycflights13) >dim(flights) >filter(flights, month == 12, day == 25) > filter(flights, month == 11 | month == 12)
Filter rows with filter() For other types of combinations, you ll need to use Boolean operators
Filter rows with filter() Between() is a shortcut for x >= left & x <= right, implemented efficiently in C++ for local values, and translated to the appropriate SQL for remote tables. >library(nycflights13) >dim(flights) > flights [between(flights$arr_delay,120,180),]
Arrange rows with arrange() arrange() works similarly to filter() except that instead of selecting rows, it changes their order. Use desc() to re-order by a column in descending order >library(nycflights13) >arrange(flights, arr_delay) >arrange(flights, desc(arr_delay))
Select columns with select() select() allows you to rapidly zoom in on a useful subset select(flights, year, month, day) There are a number of helper functions you can use within select() : starts_with("abc") : matches names that begin with abc . ends_with("xyz") : matches names that end with xyz . contains("ijk") : matches names that contain ijk . matches("(.)\\1") : selects variables that match a regular expression..
Select columns with select() rename() can be used to rename variables while keeps all the variables that aren t explicitly mentioned rename(flights, tail_num = tailnum)
Add new variables with mutate() Besides selecting sets of existing columns, it s often useful to add new columns that are functions of existing columns. That s the job of mutate() . mutate() always adds new columns at the end of your dataset >mutate(flights, gain = arr_delay - dep_delay, speed = distance / air_time * 60 )
Add new variables with mutate() Besides selecting sets of existing columns, it s often useful to add new columns that are functions of existing columns. That s the job of mutate() . mutate() always adds new columns at the end of your dataset >mutate(flights, gain = arr_delay - dep_delay, speed = distance / air_time * 60) If you only want to keep the new variables, use transmute() >transmute(flights, gain = arr_delay - dep_delay, speed = distance / air_time * 60)
Grouped summaries with summarise() summarise() . It collapses a data frame to a single row: >summarise(flights, delay = mean(dep_delay, na.rm = TRUE)) summarise() is not useful unless we pair it with group_by() . This changes the unit of analysis from the complete dataset to individual groups.
magrittr forward-pipe operator provides a new pipe -like operator, %>%, with which you may pipe a value forward into an expression or function call; it semantically changes your code in a way that makes it more intuitive to both read and write. By default the left-hand side (LHS) will be piped in as the first argument of the function appearing on the right-hand side (RHS). %>% may be used in a nested fashion, e.g. it may appear in expressions within arguments. When the LHS is needed at a position other than the first, one can use the dot,'.', as placeholder. The dot in e.g. a formula is not confused with a placeholder, which is utilized in the aggregate expression. Whenever only one argument is needed, the LHS, then one can omit the empty parentheses. A pipeline with a dot (.) as LHS will create a unary function.
