Student Engagement with Augmented Reality Sandbox
Understanding Student
Engagement while Using
an Augmented Reality
Sandbox
NICHOLAS SOLTIS
1
, KAREN MCNEAL
1
, RACHEL ATKINS
2
, LINDSAY MAUDLIN
2
1
AUBURN UNIVERSITY, DEPARTMENT OF GEOSCIENCES
2
NC STATE UNIVERSITY, DEPARTMENT OF MARINE, EARTH, AND ATMOSPHERIC SCIENCE
1
Why Engagement?
Engagement is “based on the constructivist assumption that learning is
influenced by how an individual participates in educationally purposeful
activities” (Coates, 2005).
The majority of literature on student engagement directly or indirectly is
concerned with improving student learning.
Thus, engagement is an essential part of the learning process
2
Skin Biosensors
Measures Sympathetic activation-increases with excitement or stressors (physical, emotional,
cognitive) (Malmivuo and Plonsey, 1995).
◦
Proxy for
engagement
The skin is the only organ that is purely innervated by the sympathetic nervous system
◦
Changes in sympathetic activation can be measured by recording subtle electrical changes across the
skin’s surface (Electrodermal Activity ( EDA) or Skin Conductance)
◦
EDA is measured in microSiemens (
μ
S)
While traditionally done on the palm, the EDA signal is discernable on the wrist (Van Dooren et
al., 2012) (Poh et al., 2010).
3
Engagement and Skin Conductance
4
BASED ON FREDRICKS, BLUMENFELD AND PARIS (2004, 62-63), DRAWING ON BLOOM (1956) AND
MALMIVUO AND PLONSEY (1995)
Hand Sensors and Engagement
Traditionally used in medicine and psychology, hand sensors are beginning to see use in
educational settings
Recent education applications:
Understand stress among autistic students during various social interactions (Goodwin, 2016), (O’Haire
et. al., 2015)
Measure engagement during various teaching approaches in an introductory environmental geology
course (McNeal et. al., 2014).
Additional applications: more rigorous activities such as while painting, using scooters, jumping
into a ball pit, and even riding a zip line (Hedman et. al., 2012).
5
The Augmented Reality Sandbox
6
Research Questions
How can Skin Biosensors be used to make sense of engagement during a geoscience lab?
◦
How do students interact with an AR sandbox?
◦
How does the use of an AR sandbox impact student engagement?
◦
How do different ways of using the AR sandbox affect engagement?
◦
What factors contribute to or are predictive of engagement while using an AR sandbox?
7
8
Methods
Skin Conductance
Dynamic Video
Post Test
Interviews
How engaged are
students using the
sandbox?
How are students
using the sandbox?
What factors can
predict Engagement
What did students
think of the
sandbox? What are
their suggestions?
Demographics
Spatial Reasoning
Skills
1
Topographic Map
Skills
2
1 PURDUE SPATIAL VISUALIZATION TEST REVISED
2 TOPOGRAPHIC MAP ASSESSMENT
Participants
Lab sections of an introductory Earth System Science course
91 students consented to wearing hand sensors and took a post test
37.4% female and 62.6% male.
33 of those students agreed to a follow-up interview
42% female and 58% male
15.4% reported being geology majors
9
Design
CALCULATING ENGAGEMENT
2 minute benchmark while students were
completing a traditional paper and pencil lab
Percent change in engagement from the 2
minute benchmark and time using the
sandbox was calculated
LAB SETUP
10
Results: Unstructured Example
11
Time (S)
Unstructured = lower engagement,
relaxation?
Results: Semi-Structured Example
12
Skin Conductance (
μ
S)
Time (S)
Semi-Structured = Fluctuations as
students figured out activity
Results: Structured Example
13
Time (S
)
Structured = Peaks often
corresponded to activities
Descriptive Statistics- Percent Change in
Skin Conductance
14
How the Sandbox is Used-Interactions with
Sandbox and Relationship to Engagement
15
R
2
= .084
p
=.038
Percent Change in Engagement= 67.98 -2.19(SB Interaction) + .02 (SB Interaction.)
2
How the Sandbox is Used-Interactions
Between Students and Relationship to
Engagement
16
R
2
= .155
p
=.006
Percent Change in Engagement= -23.65 +8.1 (Social collab) - .2 (social collab.)
2
+ .001 (social collab.)
3
Spatial Reasoning and Engagement
Regression Model
17
Percent change in Engagement= 12.98 + .568 (Spatial Reasoning Score)
2
R
2
= .070
p
=.012
Conclusions
1.
There is a significant increase in engagement between the benchmark before using the sandbox
and while using the sandbox ,
regardless of treatment
(
p
=.002)
2.
Though there was a difference in means
between treatments
, it was not found to be significant
◦
High standard deviations reduced the power to detect an effect
◦
Structured and Semi-Structured Labs had higher means than the unstructured labs
3.
There is a statistically significant quadratic relationship between spatial reasoning skills and
engagement (
R
2
= .070,
p
=.012).
4.
There is a statistically significant cubic relationship between how much students interact socially
and engagement (
R
2
= .155,
p
=.006).
5.
There is a statistically significant quadratic relationship between how much students interact
collaboratively with the sandbox and engagement (
R
2
= .084,
p
=.038).
6.
Interaction time between groups of students and the sandbox is significantly higher during the
structured vs. unstructured lab
(p
=.016)
.
18
Recommendations
FUTURE RESEARCH
Establish a baseline for engagement during a
paper and pencil lab
Increase 2 minute benchmark period before
sandbox interaction
Compare classroom settings to controlled
settings
Analyze a combination of approaches (e.g. A lab
containing structured and unstructured
elements)
Continue to explore connections between
sandbox use and spatial reasoning skills
FOR CLASSROOM USE
Provide students a clipboard while doing more
structured lab activities
Keep a facilitator near the sandbox to assist
students
Provide flexible time limits
Try to keep groups at the sandbox no greater
than 4 students
Pair free play/ exploration with more
structured activities
19
Acknowledgements
Thanks to Dr. Katherine Ryker, Dr. Nicole LaDue, Dr. Shelly Whitmeyer, Dr. Scott
Giorgis for their related work on the AR sandbox and learning outcomes
Thanks to Dr. Katherine Ryker and Dr. Shelly Whitmeyer for authoring and
sharing the lab materials used
Thanks to Auburn University Department of Geosciences Advisory Board for
travel funds
Thanks to North Carolina State University Department of Marine, Earth, and
Atmospheric Sciences for providing a venue for our study
20
References
Bloom, B.S. (ed.) (1956) Taxonomy of Educational Objectives: the Classification of Educational Goals. New York: D McKay & Co, Inc
.
Coates, H. (2005) The Value of Student Engagement for Higher Education Quality Assurance. Quality in Higher Education. 11 (1), pp. 25–36.
Fredricks, J.A., Blumenfeld, P.C. and Paris, A.H. (2004) School Engagement: Potential of the Concept, State of the Evidence. Review of Educational Research. 74 (1), pp.
59–109.
Goodwin, M. S. (2016). 28.2 Laboratory and home-based assessment of electrodermal activity in individuals with autism spectrum disorders.
Journal of the American Academy Of Child &
Adolescent Psychiatry
,
55
S301-S302. doi:10.1016/j.jaac.2016.07.280
Guay, R. (1976). Purdue Spatial Visualization Test. West Lafayette, IN: Purdue Research Foundation.
Hedman, E., Miller, L., Schoen, S., Nielsen, D., Goodwin, M., & Picard, R. W. (2012, September). Measuring autonomic arousal during therapy. In Proc. of Design and Emotion (pp. 11-14).
Jacovina, M. E., Ormand, C., Shipley, T. F., & Weisberg, S. M. (2014). Topographic Map Assessment [Measurement Instrument]. Retrieved from http://silcton.
spatiallearning.org/index.php/resources/testsainstruments.
Malmivuo, J., & Plonsey, R. (1995).
Bioelectromagnetism: Principles and applications of bioelectric and biomagnetic fields
. Oxford University Press, USA.
McNeal, K.S., Spray, J.M., Mitra, R., Tipton, J.L. (2014). Measuring student engagement, knowledge, and perceptions of climate change in an introductory environmental geology course.
Journal
of Geoscience Education,
62, 655-667
O'Haire, M. E., McKenzie, S. J., Beck, A. M., & Slaughter, V. (2015). Animals may act as social buffers: Skin conductance arousal in children with autism spectrum disorder in a social context.
Developmental psychobiology
,
57
(5), 584-595.
Poh, M. Z., Swenson, N. C., & Picard, R. W., (2010). A wearable sensor for unobtrusive, long-term assessment of electrodermal activity.
IEEE Transactions on Biomedical Engineering, 57
(5).
Van Dooren, M., De Vries, J. J., Janssen, J. H. (2012). Emotional sweating across the body: comparing 16 different skin conductance measurements locations
.
Physiology & Behavior, 106
(2), 298-
304.
21
Conclusions
1.
There is a significant increase in engagement between the benchmark before using the sandbox
and while using the sandbox,
regardless of treatment
(
p
=.002)
2.
Though there was a difference in means
between treatments
, it was not found to be significant
◦
High standard deviations reduced the power to detect an effect
◦
Structured and Semi-Structured Labs had higher means than the unstructured labs
3.
There is a statistically significant quadratic relationship between spatial reasoning skills and
engagement (
R
2
= .070,
p
=.012).
4.
There is a statistically significant cubic relationship between how much students interact socially
and engagement (
R
2
= .155,
p
=.006).
5.
There is a statistically significant quadratic relationship between how much students interact
collaboratively in the sandbox and engagement (
R
2
= .084,
p
=.038).
6.
Interaction time between groups of students and the sandbox is significantly higher during the
structured vs. unstructured lab
(p
=.016)
.
22
Descriptive Statistics- Interview Data:
Rating the Sandbox
23
How would you rank your experience in the AR Sandbox?
Engagement and
Spatial Reasoning and
Topographic Map Skills
24
LOW AND HIGH REPRESENT THE APROXIMATE TOP AND BOTTOM THIRD OF SCORES
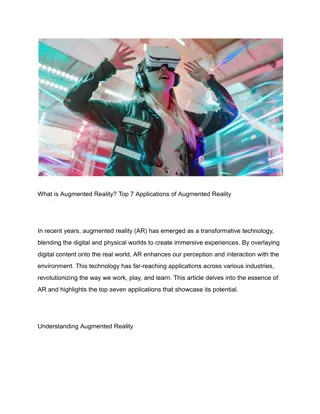
Engagement in learning is crucial for student progress, with a focus on how individuals participate in purposeful educational activities. This study explores the use of skin biosensors to measure sympathetic activation as a proxy for engagement in students while using an augmented reality sandbox. The dimensions of engagement include behavioral, emotional, and cognitive aspects, with a look at how hand sensors can further aid in understanding student engagement in various educational settings.

Download Presentation

Please find below an Image/Link to download the presentation.
The content on the website is provided AS IS for your information and personal use only. It may not be sold, licensed, or shared on other websites without obtaining consent from the author.If you encounter any issues during the download, it is possible that the publisher has removed the file from their server.
You are allowed to download the files provided on this website for personal or commercial use, subject to the condition that they are used lawfully. All files are the property of their respective owners.
The content on the website is provided AS IS for your information and personal use only. It may not be sold, licensed, or shared on other websites without obtaining consent from the author.
E N D
Presentation Transcript
Understanding Student Engagement while Using an Augmented Reality Sandbox NICHOLAS SOLTIS1, KAREN MCNEAL1, RACHEL ATKINS2, LINDSAY MAUDLIN2 1 AUBURN UNIVERSITY, DEPARTMENT OF GEOSCIENCES 2NC STATE UNIVERSITY, DEPARTMENT OF MARINE, EARTH, AND ATMOSPHER IC SCIENCE 1
Why Engagement? Engagement is based on the constructivist assumption that learning is influenced by how an individual participates in educationally purposeful activities (Coates, 2005). The majority of literature on student engagement directly or indirectly is concerned with improving student learning. Thus, engagement is an essential part of the learning process 2
Skin Biosensors Measures Sympathetic activation-increases with excitement or stressors (physical, emotional, cognitive) (Malmivuo and Plonsey, 1995). Proxy for engagement The skin is the only organ that is purely innervated by the sympathetic nervous system Changes in sympathetic activation can be measured by recording subtle electrical changes across the skin s surface (Electrodermal Activity ( EDA) or Skin Conductance) EDA is measured in microSiemens ( S) While traditionally done on the palm, the EDA signal is discernable on the wrist (Van Dooren et al., 2012) (Poh et al., 2010). 3
Engagement and Skin Conductance Dimensions of Engagement Dimensions of Engagement Sympathetic Activation Behavioral Engagement Emotional Engagement Cognitive Engagement Behavioral Engagement Emotional Engagement Cognitive Engagement Physical Stressors Emotional Stressors Cognitive Stressors Are students involved? Are students involved? Are students interested? Are students interested? Are students challenged? Are students challenged? BASED ON FREDRICKS, BLUMENFELD AND PARIS (2004, 62-63), DRAWING ON BLOOM (1956) AND MALMIVUO AND PLONSEY (1995) 4
Hand Sensors and Engagement Traditionally used in medicine and psychology, hand sensors are beginning to see use in educational settings Recent education applications: Understand stress among autistic students during various social interactions (Goodwin, 2016), (O Haire et. al., 2015) Measure engagement during various teaching approaches in an introductory environmental geology course (McNeal et. al., 2014). Additional applications: more rigorous activities such as while painting, using scooters, jumping into a ball pit, and even riding a zip line (Hedman et. al., 2012). 5
Research Questions How can Skin Biosensors be used to make sense of engagement during a geoscience lab? How do students interact with an AR sandbox? How does the use of an AR sandbox impact student engagement? How do different ways of using the AR sandbox affect engagement? What factors contribute to or are predictive of engagement while using an AR sandbox? 7
How engaged are students using the sandbox? Skin Conductance How are students using the sandbox? Dynamic Video Demographics Methods What factors can predict Engagement Post Test Spatial Reasoning Skills1 What did students think of the sandbox? What are their suggestions? Topographic Map Skills2 Interviews 1 PURDUE SPATIAL VISUALIZATION TEST REVISED 2 TOPOGRAPHIC MAP ASSESSMENT 8
Participants Lab sections of an introductory Earth System Science course 91 students consented to wearing hand sensors and took a post test 37.4% female and 62.6% male. 33 of those students agreed to a follow-up interview 42% female and 58% male 15.4% reported being geology majors 9
Design LAB SETUP CALCULATING ENGAGEMENT 2 minute benchmark while students were completing a traditional paper and pencil lab Structured Unstructured Lab Semi-Structured Lab Lab Percent change in engagement from the 2 minute benchmark and time using the sandbox was calculated Listing rules about topographic maps learned while using sandbox Completing specific tasks in the sandbox and answering questions No assignment, Free use of sandbox 10
Results: Unstructured Example Unstructured = lower engagement, relaxation? Time (S) 11
Results: Semi-Structured Example Semi-Structured = Fluctuations as students figured out activity Time (S) 12
Results: Structured Example Structured = Peaks often corresponded to activities Time (S) 13
Descriptive Statistics- Percent Change in Skin Conductance Condition at Sandbox Mean N Standard Deviation Unstructured 27.6% 34 77.4% Semi-Structured 44.2% 30 48.9% Structured 42.5% 27 62.7% Total 37.5% 91 64.5% Percent Change = ??????? ?????????? ?? ??????? ??????? ?????????? ????? ?? ??????? ??????? ?????????? ????? ?? ??????? x 100 14
How the Sandbox is Used-Interactions with Sandbox and Relationship to Engagement How students spend their time at the AR Sandbox R2= .084 p=.038 60 50 Percent of Occurences 40 30 20 10 0 Building Individually Building in Small Groups Building as a whole group Writing Looking at paper Inactivity, looking off Receiving instruction Activity Unstructured Semi-Structured Structured Percent Change in Engagement= 67.98 -2.19(SB Interaction) + .02 (SB Interaction.)2 15
How the Sandbox is Used-Interactions Between Students and Relationship to Engagement Social Interactions at AR Sandbox 60 R2= .155 p=.006 50 Percent of Occurences 40 30 20 10 0 Silence On Topic On topic converstation whole group Off Topic Off Topic Talking to facilitator Conversation Small Group Conversaion small group conversation whole group Activity Unstructured Semi-Structured Structured Percent Change in Engagement= -23.65 +8.1 (Social collab) - .2 (social collab.)2 + .001 (social collab.)3 16
Spatial Reasoning and Engagement Regression Model Percent change in Engagement= 12.98 + .568 (Spatial Reasoning Score)2 R2= .070 p=.012 17
Conclusions 1. There is a significant increase in engagement between the benchmark before using the sandbox and while using the sandbox , regardless of treatment (p=.002) 2. Though there was a difference in means between treatments, it was not found to be significant High standard deviations reduced the power to detect an effect Structured and Semi-Structured Labs had higher means than the unstructured labs 3. There is a statistically significant quadratic relationship between spatial reasoning skills and engagement (R2= .070, p=.012). 4. There is a statistically significant cubic relationship between how much students interact socially and engagement (R2= .155, p=.006). 5. There is a statistically significant quadratic relationship between how much students interact collaboratively with the sandbox and engagement (R2= .084, p=.038). 6. Interaction time between groups of students and the sandbox is significantly higher during the structured vs. unstructured lab(p=.016). 18
Recommendations FUTURE RESEARCH FOR CLASSROOM USE Establish a baseline for engagement during a paper and pencil lab Provide students a clipboard while doing more structured lab activities Increase 2 minute benchmark period before sandbox interaction Keep a facilitator near the sandbox to assist students Compare classroom settings to controlled settings Provide flexible time limits Analyze a combination of approaches (e.g. A lab containing structured and unstructured elements) Try to keep groups at the sandbox no greater than 4 students Pair free play/ exploration with more structured activities Continue to explore connections between sandbox use and spatial reasoning skills 19
Acknowledgements Thanks to Dr. Katherine Ryker, Dr. Nicole LaDue, Dr. Shelly Whitmeyer, Dr. Scott Giorgis for their related work on the AR sandbox and learning outcomes Thanks to Dr. Katherine Ryker and Dr. Shelly Whitmeyer for authoring and sharing the lab materials used Thanks to Auburn University Department of Geosciences Advisory Board for travel funds Thanks to North Carolina State University Department of Marine, Earth, and Atmospheric Sciences for providing a venue for our study 20
References Bloom, B.S. (ed.) (1956) Taxonomy of Educational Objectives: the Classification of Educational Goals. New York: D McKay & Co, Inc. Coates, H. (2005) The Value of Student Engagement for Higher Education Quality Assurance. Quality in Higher Education. 11 (1), pp. 25 36. Fredricks, J.A., Blumenfeld, P.C. and Paris, A.H. (2004) School Engagement: Potential of the Concept, State of the Evidence. Review of Educational Research. 74 (1), pp.59 109. Goodwin, M. S. (2016). 28.2 Laboratory and home-based assessment of electrodermal activity in individuals with autism spectrum disorders. Journal of the American Academy Of Child & Adolescent Psychiatry, 55S301-S302. doi:10.1016/j.jaac.2016.07.280 Guay, R. (1976). Purdue Spatial Visualization Test. West Lafayette, IN: Purdue Research Foundation. Hedman, E., Miller, L., Schoen, S., Nielsen, D., Goodwin, M., & Picard, R. W. (2012, September). Measuring autonomic arousal during therapy. In Proc. of Design and Emotion (pp. 11-14). Jacovina, M. E., Ormand, C., Shipley, T. F., & Weisberg, S. M. (2014). Topographic Map Assessment [Measurement Instrument]. Retrieved from http://silcton. spatiallearning.org/index.php/resources/testsainstruments. Malmivuo, J., & Plonsey, R. (1995). Bioelectromagnetism: Principles and applications of bioelectric and biomagnetic fields. Oxford University Press, USA. McNeal, K.S., Spray, J.M., Mitra, R., Tipton, J.L. (2014). Measuring student engagement, knowledge, and perceptions of climate change in an introductory environmental geology course. Journal of Geoscience Education, 62, 655-667 O'Haire, M. E., McKenzie, S. J., Beck, A. M., & Slaughter, V. (2015). Animals may act as social buffers: Skin conductance arousal in children with autism spectrum disorder in a social context. Developmental psychobiology, 57(5), 584-595. Poh, M. Z., Swenson, N. C., & Picard, R. W., (2010). A wearable sensor for unobtrusive, long-term assessment of electrodermal activity. IEEE Transactions on Biomedical Engineering, 57(5). Van Dooren, M., De Vries, J. J., Janssen, J. H. (2012). Emotional sweating across the body: comparing 16 different skin conductance measurements locations. Physiology & Behavior, 106(2), 298- 304. 21
Conclusions 1. There is a significant increase in engagement between the benchmark before using the sandbox and while using the sandbox, regardless of treatment (p=.002) 2. Though there was a difference in means between treatments, it was not found to be significant High standard deviations reduced the power to detect an effect Structured and Semi-Structured Labs had higher means than the unstructured labs 3. There is a statistically significant quadratic relationship between spatial reasoning skills and engagement (R2= .070, p=.012). 4. There is a statistically significant cubic relationship between how much students interact socially and engagement (R2= .155, p=.006). 5. There is a statistically significant quadratic relationship between how much students interact collaboratively in the sandbox and engagement (R2= .084, p=.038). 6. Interaction time between groups of students and the sandbox is significantly higher during the structured vs. unstructured lab(p=.016). 22
Descriptive Statistics- Interview Data: Rating the Sandbox How would you rank your experience in the AR Sandbox? Treatment Mean N Standard Deviation Unstructured 8.83 6 0.983 Semi-Structured 8.29 14 1.326 Structured 9.15 13 0.987 Total 8.73 33 1.180 23
Engagement and Spatial Reasoning and Topographic Map Skills Spatial Thinking Skills Mean Percent Change in Engagement N Standard Deviation Low 26.0% 35 47.8% High 52.3% 33 85.9% Topographic Map Skills Mean Percent Change in Engagement N Standard Deviation Low 24.7% 23 54.4% High 55.6% 21 89.6% 24 LOW AND HIGH REPRESENT THE APROXIMATE TOP AND BOTTOM THIRD OF SCORES