State of Tennessee THEC Space Seminar Guidelines
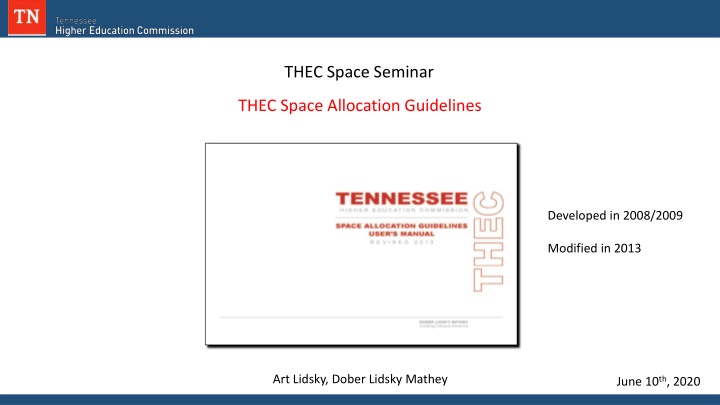
THEC Space Allocation Guidelines developed in 2008/2009 and modified in 2013 categorize space use into seven parts covering classrooms, laboratories, offices, libraries, physical education, and more. The guidelines outline specific room use codes and facilities inventory classifications for various spaces like classrooms, laboratories, offices, healthcare facilities, and others.

Uploaded on Mar 01, 2025 | 0 Views
Download Presentation

Please find below an Image/Link to download the presentation.
The content on the website is provided AS IS for your information and personal use only. It may not be sold, licensed, or shared on other websites without obtaining consent from the author.If you encounter any issues during the download, it is possible that the publisher has removed the file from their server.
You are allowed to download the files provided on this website for personal or commercial use, subject to the condition that they are used lawfully. All files are the property of their respective owners.
The content on the website is provided AS IS for your information and personal use only. It may not be sold, licensed, or shared on other websites without obtaining consent from the author.
E N D
Presentation Transcript
State of Tennessee THEC Space Seminar THEC Space Allocation Guidelines Developed in 2008/2009 Modified in 2013 Art Lidsky, Dober Lidsky Mathey June 10th, 2020
The Guidelines consists of seven parts, each part representing one of the seven space use categories. Part Space Use Category FICM I Classrooms 100/115 II Teaching Laboratory and Studio (Scheduled) 210/215 III Open Laboratory and Studio (Unscheduled) 220/225 IV Research Laboratory 250/255 V Office and Support 300 VI Library, Study, Information Commons 400 VII Physical Education 520/523/525
Room Use Code 01.000.50 01.000.60 01.000.70 000 Inactive 100 Classrooms Room Use Code 01.700.10 01.700.15 01.700.20 01.700.25 01.700.30 01.700.35 01.700.40 01.700.45 01.700.50 01.700.55 01.700.60 01.700.70 01.700.75 01.700.80 Facilities Inventory Classification Manual Description Inactive Area Alteration or Conversion Area Unfinished Area Description Central Computer or Telecommunications Central Computer or Telecommunications Service Shop Shop Service Central Storage Central Storage Service Vehicle Storage Vehicle Storage Service Central Service Central Service Support Hazardous Materials Storage Hazardous Waste Storage Hazardous Waste Service Unit Storage 700 service 01.100.10 01.100.15 Classroom Classroom Service 01.200.10 01.200.15 01.200.20 01.200.25 01.200.50 01.200.55 300 Office Class Laboratory Class Laboratory Service Open Laboratory Open Laboratory Service Research/non-class Laboratory Research/non-class Laboratory Service 200 Laboratories 01.300.10 01.300.15 01.300.50 01.300.55 400 Study Office Office Service Conference Room Conference Room Service 01.800.10 01.800.15 01.800.20 01.800.30 01.800.35 01.800.40 01.800.45 01.800.50 01.800.55 01.800.60 01.800.65 01.800.70 01.800.80 01.800.90 01.800.95 Patient Bedroom Patient Bedroom Service Patient Bath Nurse Station Nurse Station Service Surgery Surgery Service Treatment/Examination Clinic Treatment/Examination Clinic Service Diagnostic Service Laboratory Diagnostic Service Laboratory Support Central Supplies Public Waiting Staff On-Call Facility Staff On-Call Facility Service 01.400.10 01.400.20 01.400.30 01.400.40 01.400.55 Study Room Stack Open-Stack Study Room Processing Room Study Service 800 Healthcare 01.500.10 01.500.15 01.500.20 01.500.23 01.500.25 01.500.30 01.500.35 01.500.40 01.500.45 01.500.50 01.500.55 01.500.60 01.500.70 01.500.75 01.500.80 01.500.85 01.500.90 Armory Armory Service Athletic or Physical Education Athletic Facilities Spectator Seating Athletic or Physical Education Service Media Production Media Production Service Clinic Clinic Service Demonstration Demonstration Service Field Building Animal Facilities Animal Facilities Service Greenhouse Greenhouse Service Other (All Purpose) 500 Special 01.900.10 01.900.19 01.900.20 01.900.35 01.900.50 01.900.55 01.900.70 Sleep/Study Without Toilet or Bath Toilet or Bath Sleep/Study With Toilet or Bath Sleep/Study Service Apartment Apartment Service House 900 Residential 02.100.00 02.100.01 02.100.02 02.100.03 02.100.04 02.100.05 02.100.06 02.100.07 02.200.00 02.200.01 02.200.02 02.200.03 02.200.04 02.300.00 02.300.01 02.300.02 02.300.03 02.300.04 02.400.00 Circulation Bridge/Tunnel Elevator Escalator Loading Dock Lobby Public Corridor Stairway Custodial Custodial Supply Closet Janitor Room Public Rest Room Trash Room Mechanical Central Utility Plant Fuel Room Shaft Utility/Mechanical Space Structural Area 01.600.10 01.600.15 01.600.20 01.600.25 01.600.30 01.600.35 01.600.40 01.600.45 01.600.50 01.600.55 01.600.60 01.600.65 01.600.70 01.600.75 01.600.80 01.600.85 Assembly Assembly Service Exhibition Exhibition Service Food Facility Food Facility Service Day Care Day Care Service Lounge Lounge Service Merchandising Merchandising Service Recreation Recreation Service Meeting Room Meeting Room Service 02.100.xx Non Assignable 600 General
FICM Defines How to Define or Measure Space Gross Sq. Ft. Net Assignable Sq. Ft. Circulation Sq. Ft.
Pink and Blue Cells The Guidelines uses color-coded cells in a spreadsheet to indicate where data is to be entered. In all cases, the spreadsheet is arranged with pink cells indicating the THEC guidelines and blue cells indicating where institutional data is to be entered. Blue Institutional Data Inputs THEC Guidelines / Planning Inputs Pink Only Change Blue Cells they are for Institutional Data
Enrollment Data This part of the spreadsheet collects enrollment data that is used in Parts III, VI, and VII. Enter on-ground FTE and headcount, online FTE, and, for those with a residential environment, the headcount of students living on campus. Enrollment Data Students FTE Headcount On Ground 12,500 15,600 On-Line 2,300 Residential 1,200 Data to Use Enrollment FTE and headcount should be consistent with Fall data reported to THEC. The same enrollment figures are used in Parts III, VI and VII, but need to be entered here only.
Part I Classrooms The following information is used to generate the data that is entered into the blue cells in Part I section. Essentially, the data required are the number of sections distributed by section size, and the number of weekly classroom hours by size. This data automatically generates the amount of space using THEC s current guidelines: A typical course file includes the following necessary fields for analysis Data From the Registrar s Course File Section Enrollment (after drop / add) Building Room Subject Days (MTWRF) Course Start Time Section End Time Faculty Name Start Date CIP Code (Labs only) End Date
Part I Classrooms For Part I, the data should include course sections that have scheduled meetings in classrooms, seminars, and lecture halls (FICM 100 spaces), as well as lecture-based courses that meet in spaces classified as auditoria (FICM 610), and conference rooms (FICM 350). Do not double-count hours for cross-registered courses - multiple sections scheduled in the same classroom at the same time. However, when calculating enrollments, the sum enrollment of all sections meeting in the same space at the same time should be used. Only credit bearing courses should be included Classroom scheduling time window for day program is 7 AM to 5 PM
Part I Classrooms There are three ways to measure how classrooms are used: 30 Hours / Wk the number of hours per week that the room is scheduled the proportion of seats that are filled when the room is scheduled 60% the amount of space allocated to each student station Table 2: Classroom Square Foot Multipliers Varies Room Capacity NASF/Seat Tables & Chairs NASF/Seat Tablet-arm Chairs Average NASF Per Seat 25 35 20 22 10 19 26 25 35 18 20 20 29 25 As pedagogy has changed, some of these multipliers should be modified active learning, for instance 20 30 16 18 30 39 21 18 22 14 16 40 49 18 18 22 14 16 50 59 18 18 22 14 16 60 99 18 16 20 12 14 100 149 17 14 18 10 12 150 16 14 18 10 12 275 14
Part I Classrooms Hours per week Station Utilization 60% Or 17 Hours 30 Section Size Number of Sections Total Weekly CR Hours Classroom Stations NASF / Station NASF per Classroom Number of Classrooms Total NASF 1 8 9 14 15 20 21 26 180 540 40 18 720 18 12,960 27 32 33 47 48 74 75 126 127+
Part II Instructional Labs and Studios There are three ways to measure how Instructional Labs and Studios are used: 15 - 20 Hours / Wk the number of hours per week that the room is scheduled the proportion of seats that are filled when the room is scheduled 80% the amount of space allocated to each student station Varies
Part II Instructional Labs and Studios Teaching Lab and Studio Multipliers - Universities with CIP Codes 14.02 Aeronautical, Aviation & Aerospace Automotive 46 Construction 14.17,15.06 Industrial Machinery and Equipment 14.19 Mechanical Engineering 15.0611 Metal, Shop, & Welding Power and Energy 14.31 Materials Science 51.24 Veterinary Medicine Category A 150 NASF / Station 01 & 02 Agriculture 14.06 Ceramic 50.03 Dance 50.05 Dramatic Arts 51.04 Dentistry 51.2306 Occupational Therapy 51.17 Optometry 51.2308 Physical Therapy 14.08 Structural Engineering Category B 100 NASF / Station 40.0502 Analytical Chemistry 26.04 Anatomy, Gross 04 Architecture 40.0202 Astrophysics 26.02 Biochemistry 26.02 Biophysics 26.04 Cell Biology 14.08 Civil Engineering 51.06 Dental Hygiene 14.01 Engineering, General 15.13 CAD/CADD Technology 01.10 Food Science and Technology 26.08 Genetics (lab-based program) 40.06 Geophysics, and Seismology 26.04 Histology 21 Tech Ed / Industrial Arts 50.04 Interior Design 04.06 Landscape Architecture 26.05 Microbiology 26.1302 Marine Biology 26.02 Molecular Biology 50.09 Music Performance 30.24 Neurosciences 51.16 Nursing - Practical and RN 40.0504 Organic Chemistry 51.2 Pharmacy 10.03 Printing and Lithography 42 Psychology (lab-based) 51.0911 Radiology Category C 75 NASF / Station 45.02 Anthropology 40.0201 Astronomy 26.01 Biology, General 40.05 Chemistry, General 09.01 Communication 11.07 Computer Science 50.07 Drawing, Painting 26.13 Ecology 16 Foreign Languages 26.08 Genetics (lecture-based program) 40.06 Geology 09.04 Journalism 26.07 Pathology 40.08 Physics, General 51.22 Public Health Category D 60 NASF / Station 52.03 Accounting 05.01 Afro-American Studies 50.07 Art History and Appreciation 52.08 Finance 13.06 Educational Statistics and Research 54 History 23&45 Humanities and Social Sciences 22 Law 50.09 Music History and Appreciation 45.10 Political Science and Government 42 Psychology (lecture-based program) 45.11 Sociology Category E 40 NASF / Station
Part II Labs and Studios Station Utilization Hours Per Wk Lower Division 20 80% Number of Sections Weekly Lab Hours Total Section Size Stations per Lab NASF per Station NASF per Lab Number of Labs Total Lab NASF Support Allocation Support NASF Total NASF Discipline Enrollment A B C 48 101 1,040 22 28 75 2,100 5 10,500 30% 4,500 15,000 D E F
Part II Labs and Studios Station Utilization Hours Per Wk Upper Division and Grads 15 75% Number of Sections Weekly Lab Hours Total Section Size Stations per Lab NASF per Station NASF per Lab Number of Labs Total Lab NASF Support Allocation Support NASF Total NASF Discipline Enrollment A B C D E F
Part III Open Labs and Studios Included in this category are unscheduled: Computer labs Writing labs Language labs Art studios Practice studios Music practice rooms Informal student collaboration spaces. These types of spaces are usually coded in facilities inventories as FICM 220/225 and 230/235. This space is allocated on a simple per-FTE basis. Currently there is no open lab allocation for online students. Part III Open Labs & Studios Student Enrollment on Ground FTE 12,500 5 62,500
Part IV A Research Labs by Research Expenditure There are two approaches for determining the amount of research space. One is based on research expenditure while the other is based on the number of people (FTE) actually doing research. The method that results in the greater amount of space will be used. Data to Use 1. Assemble research expenditures for the previous 3 years. 2. Break down expenditures into 3 categories: A) highly space-intensive, B) space-intensive, or C) moderately space-intensive. 3. Further break down data into on-campus and off-campus expenditure. 4. Find the 3-year average for each of these categories and enter data in spreadsheet
Part IV A Research Labs by Research Expenditure Space-Use Intensity Discipline - Space Use Category using CIP Code 14.08 Civil Engineering 14.10 Electrical 14.01 Engineering Industrial Engineering 14.18 Materials A 14.02 Aero Engineering 14.05 Bioengineering 14.07 Chemical Engineering 40.05 Chemistry 14.31 Materials Science 14.19 Mechanical, Medical 51.2 Veterinary Science Highly Space- Intensive 01 & 02 Agriculture 26.04 Anatomy 1.09 Animal Science 45.02 Anthropology (lab-based) 40.02 Astronomy 26 Biology 26.02 Biochemistry 26.0102 Biomedical 40 Chemistry 14.09 Computer Engineering 1.03 Crop Science 51.04 Dentistry 15.03 Electrical Engineering 1.1 Food Science 40.06 Geology 14.19 Mechanical Engineering 26.05 Microbiology 30.24 Neuroscience 40.08 Physics 26.03 Plant Pathology 42 Psychology (lab-based) B Space- Intensive 52.03 Accounting 4.02 Architecture, Art 50 Fine & Performing Arts 11.07 Computer Science Earth Science C 54 History 23 & 45 Humanities 22 Law 27 Math 50.09 Music 51.16 Nursing 51.2 Pharmacy 45.10 Political Science 45 Social Science Moderately Space- Intensive 45.02 Anthropology (office-based) 52 Business 11 Computer Sci. (office-based) 13 Education 22 Law Foreign Languages 27 Math 42 Psychology (office-based) 23 & 45 Social Sciences & Humanities 44.07 Social Work 27.05 Statistics D Office- based
Part IV A Research Labs by Research Expenditure There are two approaches for determining the amount of research space. One is based on research expenditure while the other is based on the number of people (FTE) actually doing research. The method that results in the greater amount of space will be used. Inflation since 2012 11% 100% 25% Expenditure: 3-year Average Inflation Adjusted On-Campus Factor Off-Campus Factor Discipline On-Campus Off-Campus NASF/$1M 6,350 5,650 0 0 A $9,600,000 5,250 4,670 44,800 0 44,800 B $1,200,000 3,450 3,100 3,700 0 3,700 C 48,500 $800,000 2,600 2,310 1,850 0 1,850 D 1,850
Part IV B Research Labs by Research Personnel This part of the spreadsheet generates the amount of research space by allocating an amount of space per researcher, depending on the category of researcher and discipline. Departments and disciplines with CIP codes are grouped into four categories. Each category has a specific set of space multipliers. Data to Use 1. The number of FTE engaged in research (faculty, PhDs, Post-docs, non-faculty, graduate students, undergrads, visitors, adjuncts). 2. The FTE quantity is entered into the blue cells by personnel category and by discipline group. 3. FTE defined by load or by contract
Part IV B Research Labs by Research Personnel Space-Use Intensity Disciplines by CIP Code A 14.02 Aero Engineering 14.05 Bioengineering 14.07 Chemical Engineering 40.05 Chemistry 14.08 Civil Engineering 14.10 Electrical 14.01 Engineering 14.18 Materials 14.31 Materials Science 14.19 Mechanical, Medical 51.2 Veterinary Science Highly Space- Intensive 01 & 02 Agriculture 26.04 Anatomy 1.09 Animal Science 45.02 Anthropology (lab-based) 40.02 Astronomy 26 Biology 26.02 Biochemistry 26.0102 Biomedical 40 Chemistry 14.09 Computer Engineering 1.03 Crop Science 51.04 Dentistry 15.03 Electrical Engineering 1.1 Food Science 40.06 Geology 14.19 Mechanical Engineering 26.05 Microbiology 30.24 Neuroscience 40.08 Physics 26.03 Plant Pathology 42 Psychology (lab-based) B Space- Intensive 52.03 Accounting 45.02 Anthropology (office-based) 4.02 Architecture, Art 50 Fine & Performing Arts 11 Computer Sci. (office-based) 11.07 Computer Science 54 History 23 & 45 Humanities 22 Law 27 Math 50.09 Music 51.16 Nursing 51.2 Pharmacy 45.10 Political Science 42 Psychology (office-based) 45 Social Science C Moderately Space- Intensive 52 Business 13 Education 22 Law 27 Math D 23 & 45 Social Sciences & Humanities 44.07 Social Work 27.05 Statistics Office- based
Part IV B Research Labs by Research Personnel NASF Multipliers by Discipline Category Personnel Category A B C D Faculty 600 450 300 50 PhD 300 225 150 50 Non-Faculty 300 225 150 50 GRA/GTA 100 75 75 50 UGs 50 50 50 50 Visitor/Adjunct 300 225 150 50 % Support 40% 35% 25% 20%
Part IV B Research Labs by Research Personnel Discipline Group - FTE Research Lab NASF / FTE Personnel Category Research Lab NASF Lab Support NASF Total NASF A B C D A B C D Faculty 14.2 122.5 68.0 77.0 600 450 300 50 87,895 43,125 131,020 PhD, Post Doc 300 225 150 50 Non-Faculty 300 225 150 50 GRA / GTA 100 75 75 50 Undergrad 50 50 50 50 Visit/Adjunct 300 225 150 50 40% 35% 25% 20% Support Allocation Total Research NASF 131,020
Part V Office Data to Use 1. Count only staff requiring office space. 2. Most staffing categories use FTE, but three categories use headcount: GTA, GRA, and Other Students. 3. Use E&G and Restricted staffing numbers only. Do not count Auxiliary employees. 4. Employee data should correspond to the point in time used for other staffing data submissions to THEC. 5. For student employees, the number should represent the typical peak headcount number for this type of employee at any one time, not the cumulative total over the course of a year.
Part V Office Personnel Category Total FTE NASF / FTE President, Chancellor 350 Provost, Vice President 240 Dean 180 Associate Dean, Dept Chair 150 Professor, Associate, Assistant 150 Other Faculty 100 Professional Staff 130 Clerical 120 Staff, Technician 100 GTA (Headcount) 60 GRA (Headcount) 40 Other Students (Headcount) 10 Other, Auditor, etc. 100 Subtotal NASF 30% Total Office NASF
Part VI Study, Library Volumes NASF/Vol NASF Total Volumes and Volume Equivalents Volumes in Compact Shelving Cartographic Collection Student Enrollment on-ground (FTE) Student Enrollment on-line (FTE) Student Living on Campus (FTE) Total Student Enrollment on-ground (HC) First 150,000 Volumes Next 150,000 Volumes 0.10 0.09 0.08 Next 300,000 Volumes Next 600,000 Volumes 0.07 Next 1,200,000 Volumes 0.06 Next 2,400,000 Volumes 0.05 Next 4,800,000 Volumes 0.04 # Tables, Carrels, Groups % of FTE Enrollment Compact Shelving 0.03 Cartographic Collection 0.02 Living on Campus 25% 25% 5% 5% On Ground, Off Campus Online A Number Subtotal Volumes and Readers NASF 12.5% % Tech Services NASF per Station # Tables, Carrels, Groups Total NASF % Tables, Carrels, Etc Total NASF 25 35 35 35 % Standard % Enhanced, Group % Reserved, Assigned % Group Study 45% 25% 25% 20% 10% Same Number
Part VII Physical Education Student Enrollment on ground (FTE) Per-institution Minimum NASF <4,000 FTE Students 40,800 Per-institution Minimum NASF 4,000 + FTE Students 68,000 Additional NASF per FTE 11 Institution Minimum NASF Per FTE Allocation Total NASF