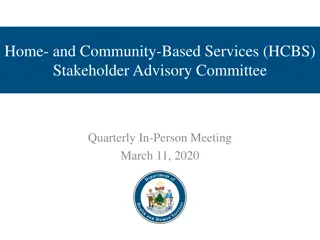
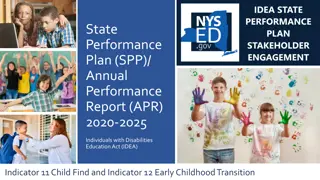
Stakeholder Engagement in SPP/APR Meeting Results and Indicators
SPP/APR Stakeholder
Meeting #2
Results Indicators 1, 2, 14 & 17
July 27, 2021
Thank you for joining us today!
•
The link is available in the chat
box
•
To open the chat, click on the
icon at the top of the screen
•
The presentation will be
recorded; the discussion after the
presentation will
not
be recorded
•
Questions may be typed into the
chat or asked at the end of the
meeting
•
You will be asked to complete a
short survey after the meeting
•
All materials will be made
available on the WVDE website

What Will Stakeholder Engagement Look Like
With the New SPP/APR? Making Requirements a
Reality!
There are new requirements for including stakeholders in the State Performance
Plan/Annual Performance Report (SPP/APR) Package starting February 1, 2022.
These requirements include:
•
Expanding the membership
of the advisory group(s) that will inform the development of the
SPP/APR and
expanding the type of advice states should seek from their stakeholders
;
•
Include a broader group of parents
, including those on the state advisory panel or other
advisory groups, advocates, and parents not typically associated with any of the parent
organizations, in the development of the SPP/APR;
•
Broadening the advice they seek from stakeholders
to include not only advice about
target
setting
but advice about
data analysis
, developing
improvement strategies
, and
evaluating
progress
; and
•
Documenting the stakeholder engagement process
. States need to provide information about
state strategies for soliciting stakeholder feedback and informing stakeholders of decisions
the state made as well as plans for making the results of target setting, data analysis,
development of improvement strategies, and evaluation available to the public.
Agenda / Objectives
•
Define and review calculations and trend data for the following
indicators:
•
Indicator 1 – Graduation
•
Indicator 2 – Drop out
•
Indicator 14 – Post School Outcomes
•
Indicator 17 – State Systemic Improvement Plan – WV GRADUATION 20/20
•
Seek your input in setting the targets for the indicators as required
for SPP/APR Federal Fiscal Years (FFY) 2020-2025
Indicators 1 & 2 – Graduation and
Drop out
•
New calculations for
graduation and drop out
•
Measured by types of exits
among Students with
Disabilities (SWD) who have an
IEP and are between ages 14
and 21
100%
Indicators 1 & 2 – Graduation and
Drop out
•
New calculations for
graduation and drop out
•
Measured by types of exits for
SWDs who have an IEP:
1.
Graduated with regular high
school diploma
Indicators 1 & 2 – Graduation and
Drop out
•
New calculations for
graduation and drop out
•
Measured by types of exits for
SWDs who have an IEP:
1.
Graduated with regular high
school diploma
2.
Graduated with an alternate
diploma or certificate
Indicators 1 & 2 – Graduation and
Drop out
•
New calculations for
graduation and drop out
•
Measured by types of exits for
SWDs who have an IEP:
1.
Graduated with regular high
school diploma
2.
Graduated with an alternate
diploma or certificate
3.
Dropped out
Indicators 1 & 2 – Graduation and
Drop out
•
New calculations for
graduation and drop out
•
Measured by types of exits for
SWDs who have an IEP:
1.
Graduated with regular high
school diploma
2.
Graduated with an alternate
diploma or certificate
3.
Dropped out
4.
Reached maximum age of 21
Graduation Calculation – Old and
New
•
Old – 4-year adjusted cohort
•
New – Number of exits
--------------------------- Divided by ------------------------
--------------------------- Divided by ------------------------
Drop out Calculation – Old and New
•
Old – Drop out / enrollment
•
New – Number of exits
--------------------------- Divided by ------------------------
--------------------------- Divided by ------------------------
Implications of the new calculations
•
There will be no penalty if a student takes longer than 4 years to
earn their regular high school diploma
•
Graduation data and drop out data are now related to each other
•
Summer school graduates will be counted in the next school year’s
data
•
Graduation and drop out will be reported two different ways:
1.
The Every Student Succeeds Act (ESSA) federal reporting will use the
old
calculations
2.
The Individuals with Disabilities Education Act (IDEA) will use the
new
calculations
Graduation Trend Data – Old and
New
Indicator 1 – Graduation - Target
Setting
•
Most recent school year not
impacted by COVID-19 was
2018-2019 (FFY2018)
•
Using the new calculation, the
actual data would have been
83.21% - the proposed baseline
•
Targets must be higher than
the baseline
•
The proposed targets reflect a
0.5% increase per year
Drop out data – Old and New
Indicator 2 – Drop out – Target
Setting
•
Most recent school year not
impacted by COVID-19 was
2018-2019 (FFY2018)
•
Using the new calculation, the
actual data would have been
6.17% - the proposed baseline
•
Targets must be lower than the
baseline
•
The proposed targets reflect a
0.5% decrease per year
Indicator 14 – Post-school Outcomes
•
Data for this indicator are collected through the One-year Follow-
up Survey (districts/schools are responsible for collection)
•
Indicator has 3 parts:
A. Enrolled in higher education (1)
B. Enrolled in higher education (1) + competitively employed (2)
C. Enrolled in higher education (1) + competitively employed (2) + enrolled in
any post-secondary education or training program or any type of
employment (3)
14A. Enrolled in Higher Education (1)
•
Higher education = 2- or 4-year
degree programs
•
Most recent school year not
impacted by COVID-19 was 2018-
2019 (FFY2018)
•
FFY2018 actual data was 18.03% -
the proposed baseline
•
Targets must be higher than
baseline
•
The proposed targets reflect a
1.0% increase per year
14B. 1 + Competitively Employed (2)
•
Competitively Employed = working 20+
hours per week at or above minimum
wage in an integrated environment
with opportunities for advancement
•
Most recent school year not impacted
by COVID-19 was 2018-2019 (FFY2018)
•
FFY2018 actual data was 45.69% - the
proposed baseline
•
Targets must be higher than baseline
•
The proposed targets reflect a 2.0%
increase per year
14C. 1 + 2 + Participation in any
education or workforce environment
(3)
•
Enrolled in any post-secondary
education or training program or
any type of employment
•
Most recent school year not
impacted by COVID-19 was 2018-
2019 (FFY2018)
•
FFY2018 actual data was 45.69% -
the proposed baseline
•
Targets must be higher than
baseline
•
The proposed targets reflect a
0.5% increase per year
Indicator 17 – State Systemic
Improvement Plan (SSIP)
aka WV
GRADUATION 20/20
•
Uses evidence-based strategies to increase graduation, reduce dropouts
and improve college and career readiness through transition services
•
111 schools currently participating
•
Progress is determined by the State identified Measurable Result (SiMR)
•
WV’s SiMR was the 2020 target for Indicator 1 - 82.1% of students with
disabilities and an IEP graduating with a 4-year regular high school
diploma
•
The proposed 2025 SiMR is 86.21% of SWDs and an IEP graduating with a
regular high school diploma
For more information about WV GRADUATION 20/20 please visit:
https://wvde.us/special-education/initiatives/graduation-20-20/
Upcoming Stakeholder Meetings
•
Wednesday August 11, 2021 – Indicators 6 Preschool LRE, 7
Preschool Outcomes, 15 Resolution Meetings and 16 Mediation
Sessions
•
Wednesday September 8, 2021 – Indicator 3 School Age
Assessments
•
Each meeting will be recorded and available for review and survey
feedback
Survey and Feedback:
Please complete the survey at the following link:
https://www.surveymonkey.com/r/July27MY2JR7F
Susan Beck, Director
Office of Federal Programs and Support
Special Education Services
304-558-2696
sbeck@k12.wv.us
Stakeholder Meeting #2 discussed indicators 1, 2, 14, and 17 on July 27, 2021. The meeting highlighted new requirements for stakeholder involvement in the State Performance Plan/Annual Performance Report (SPP/APR) starting February 1, 2022. It emphasized expanding and documenting stakeholder engagement processes to include diverse groups in advising, target setting, data analysis, and strategy development. The agenda focused on defining indicators, calculating trend data, and seeking input for setting targets for indicators 1, 2, 14, and 17 for FFY 2020-2025.

Download Presentation

Please find below an Image/Link to download the presentation.
The content on the website is provided AS IS for your information and personal use only. It may not be sold, licensed, or shared on other websites without obtaining consent from the author. Download presentation by click this link. If you encounter any issues during the download, it is possible that the publisher has removed the file from their server.
E N D
Presentation Transcript
SPP/APR Stakeholder Meeting #2 Results Indicators 1, 2, 14 & 17 July 27, 2021
Thank you for joining us today! Please sign-in using the following URL: https://forms.office.com/r/ZTqTT AULTf The link is available in the chat box To open the chat, click on the icon at the top of the screen The presentation will be recorded; the discussion after the presentation will not be recorded Questions may be typed into the chat or asked at the end of the meeting You will be asked to complete a short survey after the meeting All materials will be made available on the WVDE website
What Will Stakeholder Engagement Look Like With the New SPP/APR? Making Requirements a Reality! There are new requirements for including stakeholders in the State Performance Plan/Annual Performance Report (SPP/APR) Package starting February 1, 2022. These requirements include: Expanding the membership of the advisory group(s) that will inform the development of the SPP/APR and expanding the type of advice states should seek from their stakeholders; Include a broader group of parents, including those on the state advisory panel or other advisory groups, advocates, and parents not typically associated with any of the parent organizations, in the development of the SPP/APR; Broadening the advice they seek from stakeholders to include not only advice about target setting but advice about data analysis, developing improvement strategies, and evaluating progress; and Documenting the stakeholder engagement process. States need to provide information about state strategies for soliciting stakeholder feedback and informing stakeholders of decisions the state made as well as plans for making the results of target setting, data analysis, development of improvement strategies, and evaluation available to the public.
Agenda / Objectives Define and review calculations and trend data for the following indicators: Indicator 1 Graduation Indicator 2 Drop out Indicator 14 Post School Outcomes Indicator 17 State Systemic Improvement Plan WV GRADUATION 20/20 Seek your input in setting the targets for the indicators as required for SPP/APR Federal Fiscal Years (FFY) 2020-2025
Indicators 1 & 2 Graduation and Drop out New calculations for graduation and drop out Measured by types of exits among Students with Disabilities (SWD) who have an IEP and are between ages 14 and 21 100%
Indicators 1 & 2 Graduation and Drop out New calculations for graduation and drop out Measured by types of exits for SWDs who have an IEP: 1. Graduated with regular high school diploma 84%
Indicators 1 & 2 Graduation and Drop out New calculations for graduation and drop out Measured by types of exits for SWDs who have an IEP: 1. Graduated with regular high school diploma 2. Graduated with an alternate diploma or certificate 10% 84%
Indicators 1 & 2 Graduation and Drop out 4.6% New calculations for graduation and drop out Measured by types of exits for SWDs who have an IEP: 1. Graduated with regular high school diploma 2. Graduated with an alternate diploma or certificate 3. Dropped out 10% 84%
Indicators 1 & 2 Graduation and Drop out 1% 4.6% New calculations for graduation and drop out Measured by types of exits for SWDs who have an IEP: 1. Graduated with regular high school diploma 2. Graduated with an alternate diploma or certificate 3. Dropped out 4. Reached maximum age of 21 10% 84%
Graduation Calculation Old and New Old 4-year adjusted cohort New Number of exits Number of cohort members who earned a regular high school diploma 4 years after enrolling as a freshman (9th Grade) for the first time Number of students graduating with a regular high school diploma at the end of the school year --------------------------- Divided by ------------------------ --------------------------- Divided by ------------------------ Number of first-time 9th graders (four years prior) + Students who transfer in over the four years - Students who transfer out, move, or die during the four-year span Number of: students earning regular diploma + those receiving an alternate diploma or certificate + students who dropped out + those reaching the maximum age of 21
Drop out Calculation Old and New Old Drop out / enrollment New Number of exits Number of students who dropped out within the school year Number of students who dropped out within the school year --------------------------- Divided by ------------------------ --------------------------- Divided by ------------------------ Number of students enrolled who were between the ages of 14 and 21 Number of: students earning regular diploma + those receiving an alternate diploma or certificate + students who dropped out + those reaching the maximum age of 21
Implications of the new calculations There will be no penalty if a student takes longer than 4 years to earn their regular high school diploma Graduation data and drop out data are now related to each other Summer school graduates will be counted in the next school year s data Graduation and drop out will be reported two different ways: 1. The Every Student Succeeds Act (ESSA) federal reporting will use the old calculations 2. The Individuals with Disabilities Education Act (IDEA) will use the new calculations
Graduation Trend Data Old and New Actual Old Target Linear (Actual Old) Actual New Linear (Actual New) 83.97 83.21 82.49 79.86 80.80 79.50 78.70 78.20 76.86 76.85 75.68 74.26 FFY2016 FFY2017 FFY2018 FFY2019 FFY2016 FFY2017 FFY2018 FFY2019
Indicator 1 Graduation - Target Setting Most recent school year not impacted by COVID-19 was 2018-2019 (FFY2018) Using the new calculation, the actual data would have been 83.21% - the proposed baseline Targets must be higher than the baseline The proposed targets reflect a 0.5% increase per year Actual New Proposed target Linear (Proposed target) 86.21 85.71 85.21 84.71 84.21 83.97 83.71 83.21 FFY2018 FFY2019 FFY2020 FFY2021 FFY2022 FFY2023 FFY2024 FFY2025
Drop out data Old and New Actual Old Target Linear (Actual Old) Actual New 8.94 6.83 6.17 4.61 2.25 2.25 2.00 1.75 1.16 0.99 0.87 0.73 FFY2016 FFY2017 FFY2018 FFY2019 FFY2016 FFY2017 FFY2018 FFY2019
Indicator 2 Drop out Target Setting Most recent school year not impacted by COVID-19 was 2018-2019 (FFY2018) Using the new calculation, the actual data would have been 6.17% - the proposed baseline Targets must be lower than the baseline The proposed targets reflect a 0.5% decrease per year Actual New Proposed target Linear (Proposed target) 6.17 5.67 5.17 4.67 4.61 4.17 3.67 3.17 FFY2018 FFY2019 FFY2020 FFY2021 FFY2022 FFY2023 FFY2024 FFY2025
Indicator 14 Post-school Outcomes Data for this indicator are collected through the One-year Follow- up Survey (districts/schools are responsible for collection) Indicator has 3 parts: A. Enrolled in higher education (1) B. Enrolled in higher education (1) + competitively employed (2) C. Enrolled in higher education (1) + competitively employed (2) + enrolled in any post-secondary education or training program or any type of employment (3)
14A. Enrolled in Higher Education (1) Actual 14A Proposed target Higher education = 2- or 4-year degree programs Most recent school year not impacted by COVID-19 was 2018- 2019 (FFY2018) FFY2018 actual data was 18.03% - the proposed baseline Targets must be higher than baseline The proposed targets reflect a 1.0% increase per year 19.86 19.22 18.03 16.42 24.03 23.03 22.03 21.03 21.00 20.03 20.00 19.03 19.00 18.00 FFY2016 FFY2017 FFY2018 FFY2019 FFY2020 FFY2021 FFY2022 FFY2023 FFY2024 FFY2025
14B. 1 + Competitively Employed (2) Actual 14B Proposed target Competitively Employed = working 20+ hours per week at or above minimum wage in an integrated environment with opportunities for advancement Most recent school year not impacted by COVID-19 was 2018-2019 (FFY2018) FFY2018 actual data was 45.69% - the proposed baseline Targets must be higher than baseline The proposed targets reflect a 2.0% increase per year 58.88 58.62 45.69 44.97 57.69 55.69 55.00 54.00 53.69 53.00 52.00 51.69 49.69 47.69 FFY2016 FFY2017 FFY2018 FFY2019 FFY2020 FFY2021 FFY2022 FFY2023 FFY2024 FFY2025
14C. 1 + 2 + Participation in any education or workforce environment (3) Enrolled in any post-secondary education or training program or any type of employment Most recent school year not impacted by COVID-19 was 2018- 2019 (FFY2018) FFY2018 actual data was 45.69% - the proposed baseline Targets must be higher than baseline The proposed targets reflect a 0.5% increase per year Actual 14C Proposed target 70.51 69.31 69.09 68.42 73.51 73.01 72.51 72.01 71.51 71.01 70.00 69.00 68.00 67.00 FFY2016 FFY2017 FFY2018 FFY2019 FFY2020 FFY2021 FFY2022 FFY2023 FFY2024 FFY2025
Indicator 17 State Systemic Improvement Plan (SSIP) aka WV GRADUATION 20/20 Uses evidence-based strategies to increase graduation, reduce dropouts and improve college and career readiness through transition services 111 schools currently participating Progress is determined by the State identified Measurable Result (SiMR) WV s SiMR was the 2020 target for Indicator 1 - 82.1% of students with disabilities and an IEP graduating with a 4-year regular high school diploma The proposed 2025 SiMR is 86.21% of SWDs and an IEP graduating with a regular high school diploma For more information about WV GRADUATION 20/20 please visit: https://wvde.us/special-education/initiatives/graduation-20-20/
Upcoming Stakeholder Meetings Wednesday August 11, 2021 Indicators 6 Preschool LRE, 7 Preschool Outcomes, 15 Resolution Meetings and 16 Mediation Sessions Wednesday September 8, 2021 Indicator 3 School Age Assessments Each meeting will be recorded and available for review and survey feedback
Survey and Feedback: Please complete the survey at the following link: https://www.surveymonkey.com/r/July27MY2JR7F Susan Beck, Director Office of Federal Programs and Support Special Education Services 304-558-2696 sbeck@k12.wv.us


")
")