St. Joseph's Catholic School Takapuna 2013 End of Year National Standard Data Analysis
Comparative data for reading, writing, and mathematics performance of the same group of children at St. Joseph's Catholic School Takapuna in the years 2012 and 2013. The data indicates changes in students' achievement levels and progress towards national standards. Results show improvements in some areas while highlighting areas needing further attention to meet national standards.
Download Presentation

Please find below an Image/Link to download the presentation.
The content on the website is provided AS IS for your information and personal use only. It may not be sold, licensed, or shared on other websites without obtaining consent from the author.If you encounter any issues during the download, it is possible that the publisher has removed the file from their server.
You are allowed to download the files provided on this website for personal or commercial use, subject to the condition that they are used lawfully. All files are the property of their respective owners.
The content on the website is provided AS IS for your information and personal use only. It may not be sold, licensed, or shared on other websites without obtaining consent from the author.
E N D
Presentation Transcript
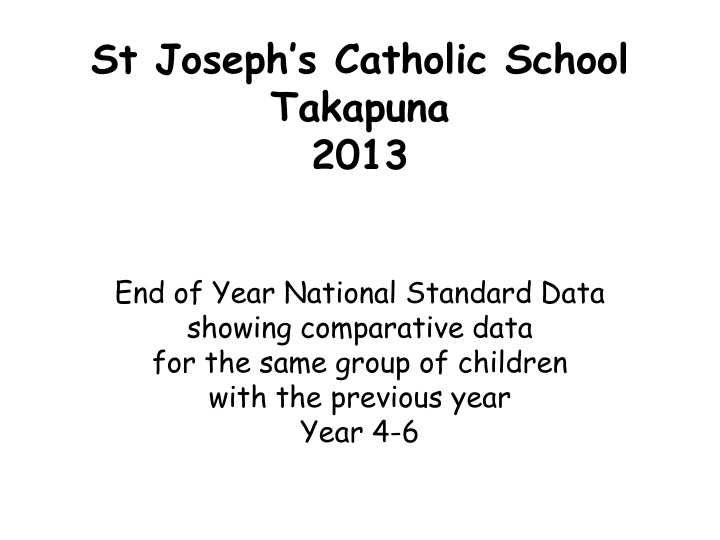
St Josephs Catholic School Takapuna 2013 End of Year National Standard Data showing comparative data for the same group of children with the previous year Year 4-6
Reading Comparative Data for the Same Group of Children Current Year 6 2012 End of Year 5 2013 End of Year 6 57.7% 58.0% 38.0% 21.2% 19.2% 4.0% 1.9% Well Below Just Below At Standard Above National Standards
Writing Comparative Data for the Same Group of Children Current Year 6 2012 End of Year 5 2013 End of Year 6 58.0% 57.7% 38.0% 21.2% 19.2% 4.0% 1.9% Well Below Just Below At Standard Above National Standards
Mathematics and Statistics Comparative Data for the Same Group of Children Current Year 6 2012 End of Year 5 2013 End of Year 6 73.1% 56.0% 40.0% 19.2% 5.8% 4.0% 1.9% Well Below Just Below At Standard Above National Standards
Reading Comparative Data for the Same Group of Children Current Year 5 2012 End of Year 4 2013 End of Year 5 80.0% 61.1% 29.2% 18.6% 9.7% 1.4% Well Below Just Below National Standards At Standard Above
Writing Comparative Data for the Same Group of Children Current Year 5 2012 End of Year 4 2013 End of Year 5 70.0% 55.6% 23.6% 20.8% 15.7% 14.3% Well Below Just Below At Standard Above National Standards
Mathematics and Statistics Comparative Data for the Same Group of Children Current Year 5 2012 End of Year 4 2013 End of Year 5 72.9% 56.9% 31.9% 18.6% 11.1% 8.6% Well Below Just Below At Standard Above National Standards
2013 Year 4 - Reading Comparison - Same Group of Children Mid Year (Progress) to End of Year (Achievement) 45 45 40 40 35 35 30 30 Number of Children 25 25 20 20 15 15 10 10 5 5 0 0 Well Below Just Below At Standard Above Well Below Just Below At Above National Standards Where The Children Are At National Standards Where The Children Are At
2013 Year 4 -Writing Comparison - Same group of Children Mid Year (Progress) to End of Year (Achievement) 45 40 40 35 35 30 Number of Children Number of Children 30 25 25 20 20 15 15 10 10 5 5 0 0 Well Below Just Below At Standard Above Well Below Just Below At Above National Standards Where The Children Are At National Standards Where The Children Are At
2013 Year 4 Mathematics and Statistics Comparison Same Group of Children Mid Year (Progress) to End Of Year (Achievement) 60 50 45 50 40 Number of Children 35 40 30 30 25 20 20 15 10 10 5 0 0 Well BelowJust Below At Above Well Below Just Below At Above Standard National Standards Where The Children Are At National Standards Where The Children Are At
The younger children are measured against the National Standards according to the time they have been at school after 1 year at school after 2 years at school after 3 years at school
2013 After 3 Years at School Reading 25 20 Number of Children 15 10 5 0 Well Below Just Below National Standards Where The Children Are At At Standard Above
2013 After 3 Years at School Writing 20 18 16 14 Number of Children 12 10 8 6 4 2 0 Well Below Just Below National Standards Where The Children Are At At Standard Above
2013 After 3 Years at School Mathematics and Statistics 25 20 Number of Children 15 10 5 0 Well Below Just Below National Standards Where The Children Are At At Standard Above
2013 After 2 Years at School Reading 35 30 25 Number of Children 20 15 10 5 0 Well Below Just Below At Standard Above National Standards Where The Children Are At
2013 After 2 Years at School Writing 40 35 30 Number of Children 25 20 15 10 5 0 Well Below Just Below At Standard Above National Standards Where The Children Are At
2013 After 2 Years at School Mathematics and Statistics 35 30 25 Number of Children 20 15 10 5 0 Well Below Just Below At Standard Above National Standards Where The Children Are At
2013 After 1 Year at School Reading 35 30 25 Number of Children 20 15 10 5 0 Well Below Just Below At Standard Above National Standards Where The Children Are At
2013 After 1 Year at School Writing 50 45 40 35 Number of Children 30 25 20 15 10 5 0 Well Below Just Below At Standard Above National Standards Where The Children Are At
2013 After 1 Year at School Mathematics and Statistics 50 45 40 35 Number of Children 30 25 20 15 10 5 0 Well Below Just Below At Standard Above National Standards Where The Children Are At
