Simplify Titration Curves Buffering Visual Analysis


Simplify Titration Curves
that Buffer
With Visual Analysis

Amy Zitzelberger
Hazel Park High School
Hazel Park, MI
Jamie Benigna
The Roeper School
Birmingham, MI

Graph originally from: MIT Open Classroom
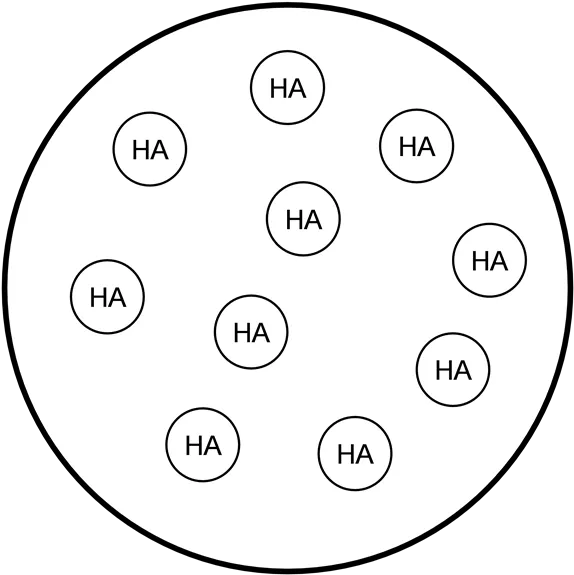
A

Point A
.
Before titration begins
:
K
a
= x
2
/ [HA] where x = [H
+
]
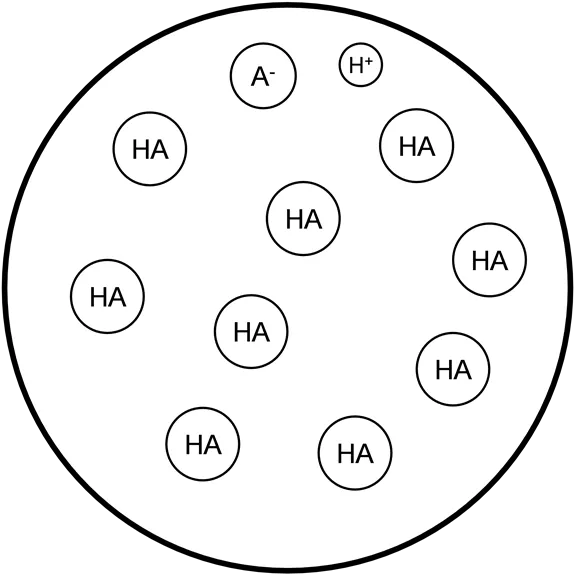

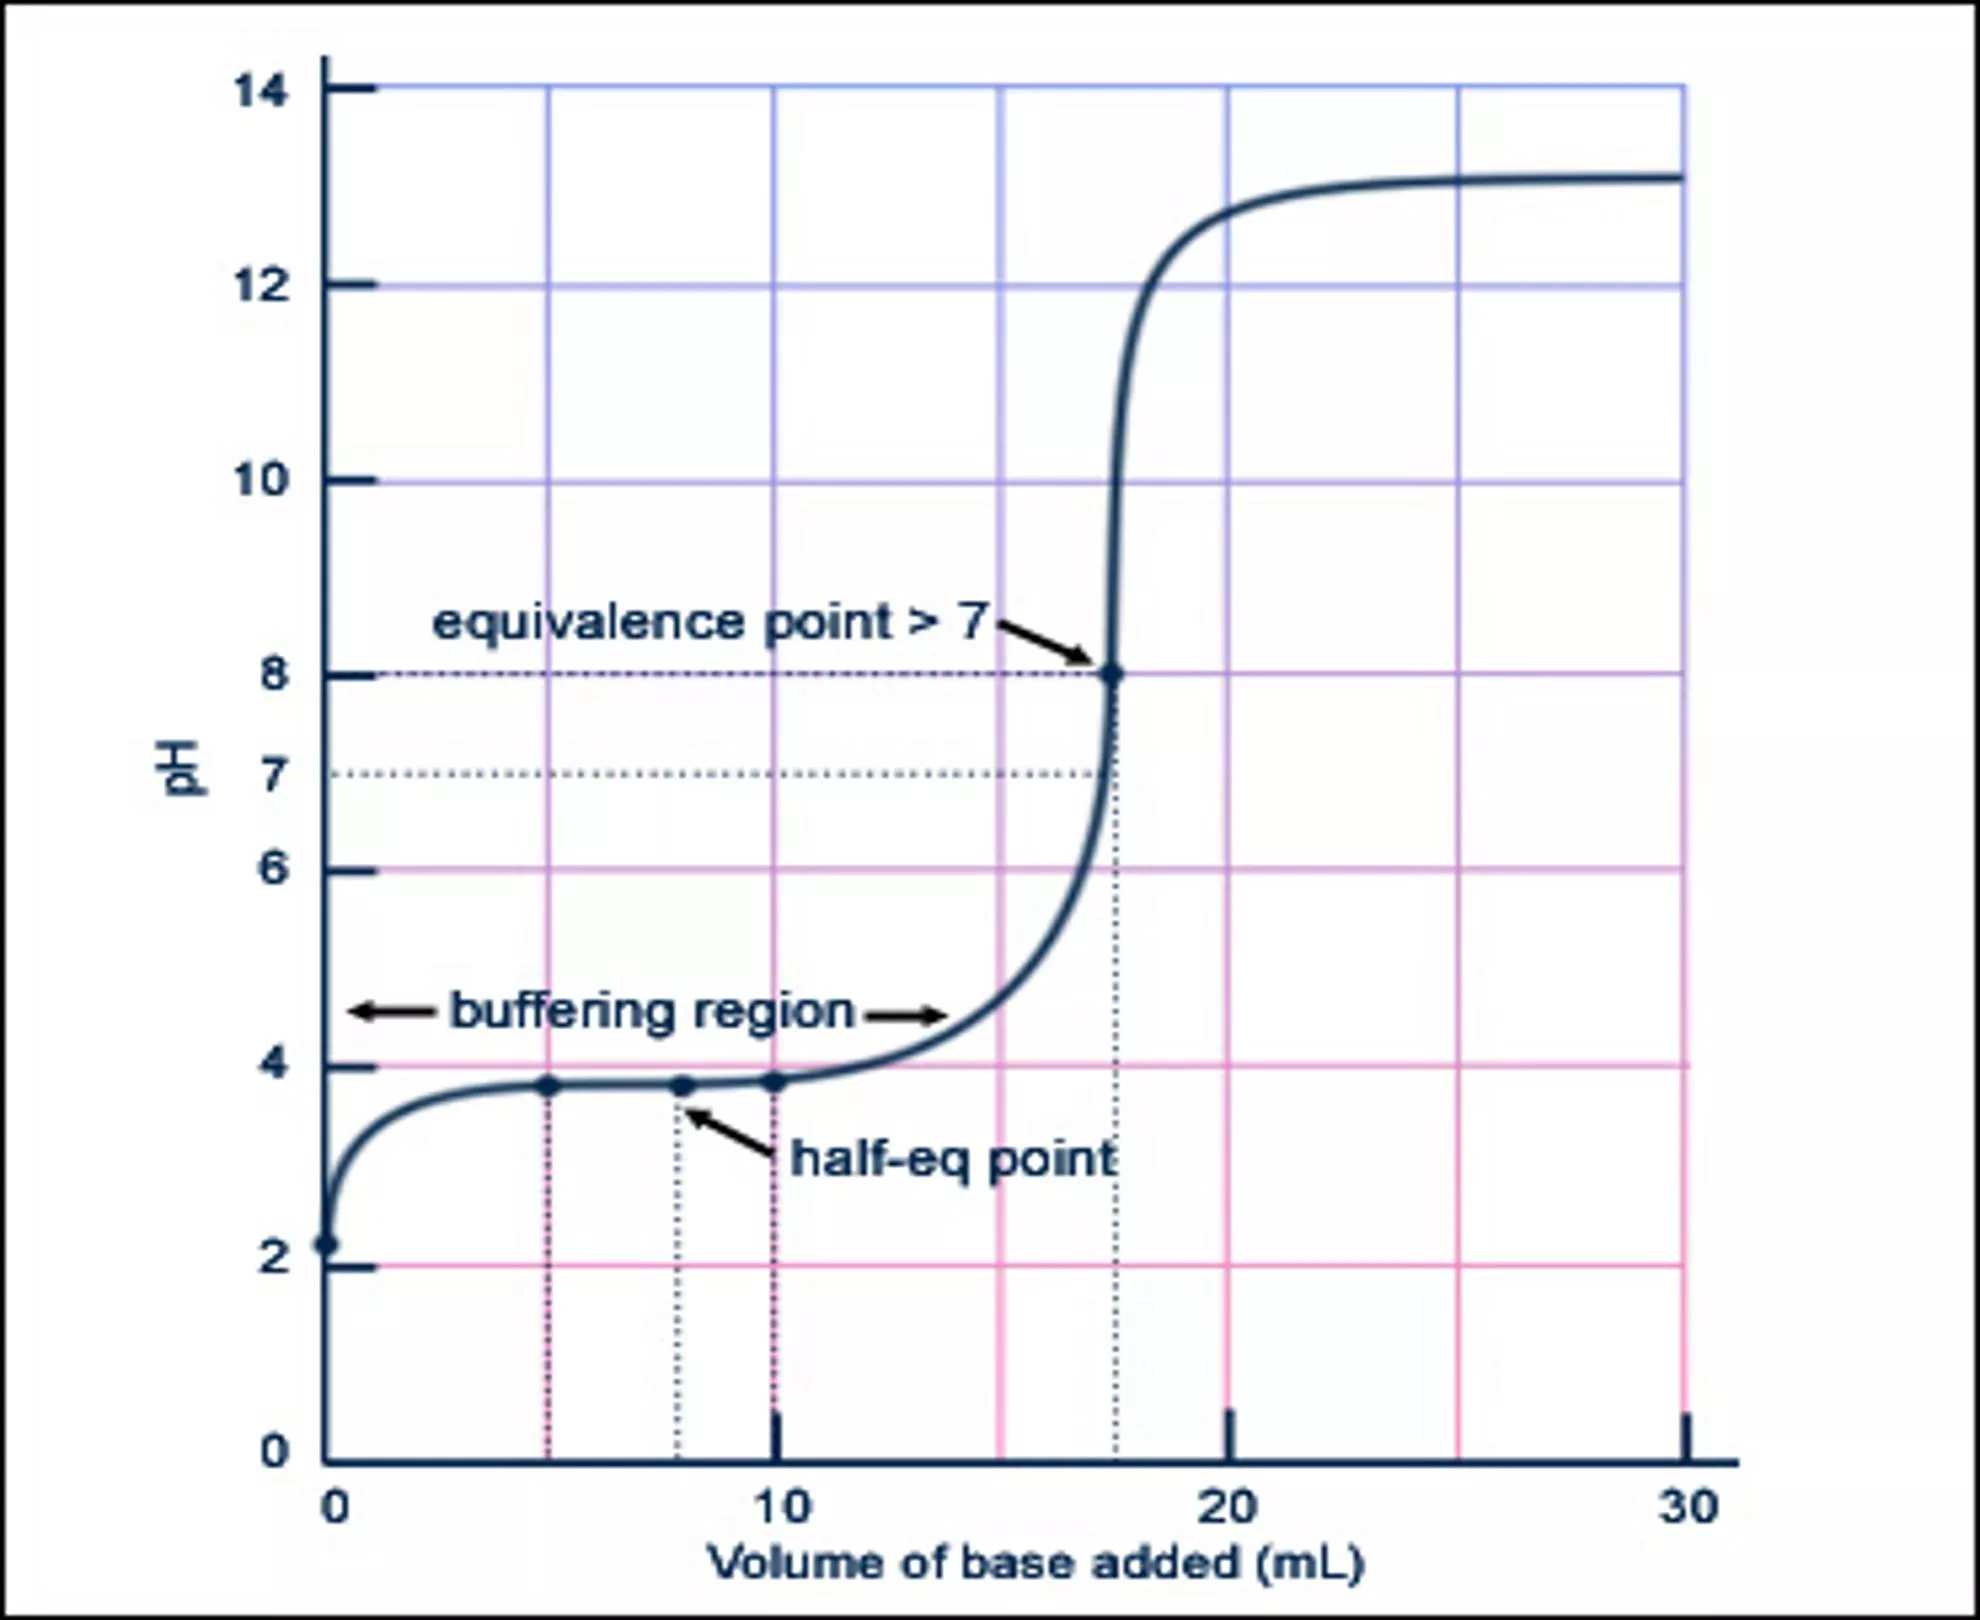
Early Buffering Region
.
Before ½ equivalence point
when buffering occurs
:
pH = pK
a
+ log [A
-
] / [HA]
where [A
-
] = OH
-
used so far
in moles, and [HA] is
remaining moles.
OH
-
A
-
Na
+
Early Buffering Region
.
Before ½ equivalence point
when buffering occurs
:
pH = pK
a
+ log [A
-
] / [HA]
where [A
-
] = OH
-
used so far
in moles, and [HA] is
remaining moles.
A
-
Na
+
OH
-
Na
+
A
-
Point C:
½ equivalence pt
:
pH = pK
a
[A-] = [HA], and log(1) = 0
A
-
Na
+
OH
-
Na
+
A
-
OH
-
Na
+
A
-
Later Buffering Region
.
After ½ equivalence point
when buffering occurs
:
pH = pK
a
+ log [A
-
] / [HA]
where [A
-
] = OH
-
used so far
in moles, and [HA] is
remaining moles.
A
-
Na
+
OH
-
Na
+
A
-
OH
-
Na
+
A
-
OH
-
Na
+
A
-
Later Buffering Region
.
After ½ equivalence point
when buffering occurs
:
pH = pK
a
+ log [A
-
] / [HA]
where [A
-
] = OH
-
used so far
in moles, and [HA] is
remaining moles.
A
-
Na
+
OH
-
Na
+
A
-
OH
-
Na
+
A
-
OH
-
Na
+
A
-
OH
-
Na
+
A
-
Point D
.
Equivalence point
:
K
b
= x
2
/ [A
-
]
where x = [OH
-
],
and [A
-
] = moles OH
-
used
over total volume.
A
-
Na
+
OH
-
Na
+
A
-
OH
-
Na
+
A
-
OH
-
Na
+
A
-
OH
-
Na
+
A
-
OH
-
Na
+
A
-
OH
-
HA
Beyond the Equivalence Pt
.
pOH = ̶ log[OH
-
] where the
OH
-
is only the moles of
excess
OH
-
divided by the
total volume.
A
-
Na
+
OH
-
Na
+
A
-
OH
-
Na
+
A
-
OH
-
Na
+
A
-
OH
-
Na
+
A
-
OH
-
Na
+
A
-
OH
-
Na
+
Beyond the Equivalence Pt
.
pOH = ̶ log[OH
-
] where the
OH
-
is only the moles of
excess
OH
-
divided by the
total volume.
A
-
Na
+
OH
-
Na
+
A
-
OH
-
Na
+
A
-
OH
-
Na
+
A
-
OH
-
Na
+
A
-
OH
-
Na
+
A
-
OH
-
Na
+
OH
-
Na
+
To Summarize
A
A
A: Before the Equiv. Pt.
B
B
B: Buffering Region
C
C
C: ½ way to Equiv. Pt.
D: Equivalence Point
D
D
E: After Equiv. Pt.
E
E
To Summarize
A
A
A: Before the Equiv. Pt.
B
B
B: Buffering Region
C
C
C: ½ way to Equiv. Pt.
D: Equivalence Point
D
D
E: After Equiv. Pt.
E
E
For example:
1) A solution of
0.20 M nitrous acid.
A
A
To Summarize
A
A
A: Before the Equiv. Pt.
B
B
B: Buffering Region
C
C
C: ½ way to Equiv. Pt.
D: Equivalence Point
D
D
E: After Equiv. Pt.
E
E
25.0 mL of 0.10 M
nitrous acid with
26.5 mL of 0.10 M
NaOH added to it.
E
E
To Summarize
A
A
A: Before the Equiv. Pt.
B
B
B: Buffering Region
C
C
C: ½ way to Equiv. Pt.
D: Equivalence Point
D
D
E: After Equiv. Pt.
E
E
25.0 mL of 0.30 M
KOH is added to
25.0 mL of 0.30 M HF.
D
D
To Summarize
A
A
A: Before the Equiv. Pt.
B
B
B: Buffering Region
C
C
C: ½ way to Equiv. Pt.
D: Equivalence Point
D
D
E: After Equiv. Pt.
E
E
A titration that has
25.0 mL of 1.00 M
acetic acid with 25.0
mL of 0.50 M NaOH.
C
C
To Summarize
A
A
A: Before the Equiv. Pt.
B
B
B: Buffering Region
C
C
C: ½ way to Equiv. Pt.
D: Equivalence Point
D
D
E: After Equiv. Pt.
E
E
When 30.0 mL of 0.20M
propanoic acid has been
titrated with 20.0 mL of
0.20 M NaOH.
B
B
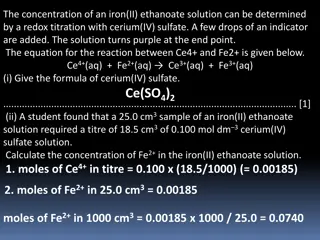
Titration curves of a buffer solution are simplified to aid in visual analysis. The process includes key points such as before, during, and after the equivalence point, with explanations of pH changes based on pKa and mole ratios of reactants.

Download Presentation

Please find below an Image/Link to download the presentation.
The content on the website is provided AS IS for your information and personal use only. It may not be sold, licensed, or shared on other websites without obtaining consent from the author.If you encounter any issues during the download, it is possible that the publisher has removed the file from their server.
You are allowed to download the files provided on this website for personal or commercial use, subject to the condition that they are used lawfully. All files are the property of their respective owners.
The content on the website is provided AS IS for your information and personal use only. It may not be sold, licensed, or shared on other websites without obtaining consent from the author.
E N D
Presentation Transcript
Simplify Titration Curves that Buffer With Visual Analysis Amy Zitzelberger Hazel Park High School Hazel Park, MI Jamie Benigna The Roeper School Birmingham, MI
Graph originally from: MIT Open Classroom H+ A- HA HA HA HA HA HA HA HA HA HA HA HA HA HA HA HA HA HA HA HA HA HA HA HA HA HA HA HA HA Point A. Before titration begins: Ka = x2 / [HA] where x = [H+] A
HA HA OH- A- HA H2O Na+ HA HA HA Early Buffering Region. Before equivalence point when buffering occurs: pH = pKa + log [A-] / [HA] where [A-] = OH- used so far in moles, and [HA] is remaining moles.
HA A- HA OH- A- H2O Na+ HA Na+ HA HA HA HA Early Buffering Region. Before equivalence point when buffering occurs: pH = pKa + log [A-] / [HA] where [A-] = OH- used so far in moles, and [HA] is remaining moles.
HA A- HA OH- A- Na+ OH- HA Na+ HA HA A- Na+ HA H2O HA Point C: equivalence pt: pH = pKa [A-] = [HA], and log(1) = 0
HA A- HA OH- A- Na+ OH- HA Na+ HA HA A- Na+ HA OH- A- Na+ HA Later Buffering Region. After equivalence point when buffering occurs: pH = pKa + log [A-] / [HA] where [A-] = OH- used so far in moles, and [HA] is remaining moles.
HA A- HA OH- A- Na+ OH- HA Na+ HA HA A- Na+ HA OH- A- OH- A- Na+ Na+ HA Later Buffering Region. After equivalence point when buffering occurs: pH = pKa + log [A-] / [HA] where [A-] = OH- used so far in moles, and [HA] is remaining moles.
HA Na+ A- HA A- OH- HA H2O OH- OH- A- Na+ OH- HA Na+ HA HA A- Na+ HA OH- A- OH- A- Na+ Na+ HA Point D. Equivalence point: Kb = x2 / [A-] where x = [OH-], and [A-] = moles OH- used over total volume.
Na+ OH- HA Na+ A- HA A- OH- OH- A- Na+ OH- HA Na+ HA HA A- Na+ HA OH- A- OH- A- Na+ Na+ HA Beyond the Equivalence Pt. pOH = log[OH-] where the OH- is only the moles of excess OH- divided by the total volume.
Na+ OH- HA Na+ A- HA A- OH- OH- A- Na+ OH- HA Na+ HA HA A- Na+ HA OH- A- OH- A- OH- Na+ Na+ HA Na+ Beyond the Equivalence Pt. pOH = log[OH-] where the OH- is only the moles of excess OH- divided by the total volume.
To Summarize E A: Before the Equiv. Pt. B: Buffering Region C: way to Equiv. Pt. D: Equivalence Point E: After Equiv. Pt. D B C A
To Summarize E A: Before the Equiv. Pt. B: Buffering Region C: way to Equiv. Pt. D: Equivalence Point E: After Equiv. Pt. D A B C A For example: 1) A solution of 0.20 M nitrous acid.
To Summarize E A: Before the Equiv. Pt. B: Buffering Region C: way to Equiv. Pt. D: Equivalence Point E: After Equiv. Pt. D E B C A 25.0 mL of 0.10 M nitrous acid with 26.5 mL of 0.10 M NaOH added to it.
To Summarize E A: Before the Equiv. Pt. B: Buffering Region C: way to Equiv. Pt. D: Equivalence Point E: After Equiv. Pt. D D B C A 25.0 mL of 0.30 M KOH is added to 25.0 mL of 0.30 M HF.
To Summarize E A: Before the Equiv. Pt. B: Buffering Region C: way to Equiv. Pt. D: Equivalence Point E: After Equiv. Pt. D C B C A A titration that has 25.0 mL of 1.00 M acetic acid with 25.0 mL of 0.50 M NaOH.
To Summarize E A: Before the Equiv. Pt. B: Buffering Region C: way to Equiv. Pt. D: Equivalence Point E: After Equiv. Pt. D B B C A When 30.0 mL of 0.20M propanoic acid has been titrated with 20.0 mL of 0.20 M NaOH.