Quantitative Aspects of Drug Action
 undefined


PHARMACODYNAMICS II
QUANTITATIVE ASPECTS OF DRUGS
Ali Alhoshani, B.Pharm, Ph.D.
Office: 2B 84


Quantitative aspects of drugs
By the end of this lecture, you should:
Determine quantitative aspects of drug receptor binding.
Recognize concentration binding curves.
Identify dose response curves and the therapeutic utility of these
curves.
Classify different types of antagonism.
QUANTIFY ASPECTS OF DRUG ACTION
Relate concentration [C] of
D
used (x- axis) to
response
produced (y-axis)
Relate concentration [C] of
D
used (x- axis) to the
binding capacity
at receptors (y-axis)
AFFINITY
A
C
o
n
c
e
n
t
r
a
t
i
o
n
-
B
i
n
d
i
n
g
C
u
r
v
e
D
o
s
e
R
e
s
p
o
n
s
e
C
u
r
v
e
s
EFFICACY
POTENCY
Concentration binding curves
Is a correlation between drug concentration [C] used
(x- axis)
and drug binding capacity at receptors [B]
(y-axis). i.e.
relation between concentration & drug binding
Concentration binding curves
Concentration binding curves
B
max
(the binding capacity)
is the total density of receptors in the tissues
K
D50
is the concentration of drug required to occupy 50% of
receptors at equilibrium.
The affinity of drug for receptor
The higher the affinity of D for receptor the lower is the K
D
i.e. inverse relation ( Binding Potential= B
max
/K
D
)
Dose -response curves
Used to study how response varies with the
concentration or dose.
Is a correlation between
drug concentration
[D] used
(x- axis)
and
drug response
[R]
(y-axis).
i.e. relation between concentration & Response
Dose -response curves
Type of Dose-response curves
Graded dose-response curve
Quantal dose-response curve
(all or none)
.
Dose -response curves
Type of Dose-response curves
Graded dose-response curve
Response is gradual
Gradual increase in response by increasing the dose
(continuous response).
, heart rate,
blood glucose level, cholesterol,…
Dose -response curves
Type of Dose-response curves
Graded dose-response curve
Curve is usually sigmoid in shape
Used to calculate
Emax
EC
50
Potency
Efficacy
Dose -response curves- Graded
M
a
x
e
f
f
e
c
t
=
E
m
a
x
Effect when all the receptors are occupied by D
EC
50
=C that gives the half-maximal effect
%
%
o
o
f
f
M
M
a
a
x
x
i
i
m
m
a
a
l
l
E
E
f
f
f
f
e
e
c
c
t
t
Dose -response curves
Dose -response curves- Graded
Used to determine
Maximum Efficacy (Emax):
is the maximal biological response
produced by a drug.
Median Effective concentration (EC50):
is the concentration of the
drug that gives 50% of the maximal response (Emax).
Potency:
the concentration of drug required to produce a specified
response (50% of the maximal response = EC50).
Potency:
is inversely proportional to EC 50.
Dose -response curves
Dose -response curves- Graded
Dose -response curves
Type of Dose-response curves
Quantal dose-response curve
Relate drug concentration to % percentage of patients responding
(all
or none response).
The response may be
therapeutic response, adverse effect or lethal
effect.
e.g.
prevention of convulsion, arrhythmias or death.
Used to determine
ED50
TD50 & LD50
Therapeutic index.
Dose -response curves-Quantal
0
2
0
4
0
6
0
8
0
1
0
0
[
[
D
D
o
o
s
s
e
e
]
]
%
s
u
b
j
e
c
t
s
r
e
s
p
o
n
d
i
n
g
A. 50% of individuals exhibit the specified therapeutic response
B
.
C.
A.
T
h
e
r
a
p
e
u
t
i
c
E
f
f
e
c
t
T
o
x
i
c
E
f
f
e
c
t
L
e
t
h
a
l
E
f
f
e
c
t
B. “
“
“
toxic effects
C. “
“
“
death
P
r
e
d
i
c
t
t
h
e
s
a
f
e
t
y
p
r
o
f
i
l
e
Therapeutic Index (T.I.)
A measure of drug safety
“The ratio of the dose that produces toxicity to the dose that
produces a clinically desired or effective response in a
population of individuals”
Therapeutic Index = TD
50
/ED
50
or LD
50
/ED
50
TD
50
is the dose that produces a toxic effect in 50% of the population.
LD
50
is the dose that is lethal in 50% of the population
ED
50
is the dose that produces therapeutic response in 50% of the population
Large value = drug has wide margin of safety
e.g diazepam
Small value = a narrow margin of safety
e.g. digoxin
Dose -response curves-Quantal
Therapeutic Index (T.I.)
Therapeutic Index (T.I.)
Antagonism
It is the decrease or the complete abolishment of the effect of
one drug in the presence of another.
Types
Physiological antagonism
Chemical antagonism
Pharmacokinetic
Pharmacodynamic antagonism (Receptor-blockade
antagonism).
Competitive
Reversible
Irreversible
Non-competitive
Antagonism
Types
Physiological antagonism
Two drugs act on different receptors to produce different
physiological effects.
e.g. Histamine & Adrenaline
Adrenaline
Vasoconstriction (
BP) & bronchodilation.
Histamine
vasodilatation (
BP) & bronchoconstriction
Antagonism
Types
Chemical antagonism
Simple chemical reaction & loss of activity
No receptor.
e.g.
Dimercaprol
reduces heavy metal toxicity (as in
lead toxicity).
Antagonism
Types
Pharmacokinetic
The antagonist effectively reduces the concentration of the
active drug at the site of action.
e.g.
Phenobarbitone
accelerates hepatic metabolism
of
warfarin
Antagonism
Types
Pharmacodynamic antagonism (Receptor-blockade
antagonism).
Competitive
Reversible
Irreversible
Non-Competitive
Antagonism
Types
Pharmacodynamic antagonism (Receptor-blockade antagonism).
Competitive
Reversible
Two drugs compete for the same receptor.
The antagonist partially or completely prevents the pharmacological
effect of agonist.
Antagonist dissociate rapidly from receptor.
Antagonism can be overcome by increasing the concentration of the
agonist.
Parallel shift of the curve to the right, without any change in slope or
maximum
e.g. acetylcholine and atropine
Antagonism
Types
Pharmacodynamic antagonism (Receptor-blockade
antagonism).
Competitive
Reversible
Antagonism
Types
Pharmacodynamic antagonism (Receptor-blockade antagonism).
Competitive
Irreversible
Two drugs compete for the same receptor.
Antagonist
forms stable, permanent chemical bond with receptor.
The original response
can not be overcome
even by increasing the
dose of the agonist.
No parallel shift
A decrease in slope and a reduced maximum are obtained.
e.g. phenoxybenzamine and noradrenaline.
Antagonism
C
o
m
p
e
t
i
t
i
v
e
r
e
v
e
r
s
i
b
l
e
a
n
t
a
g
o
n
i
s
t
v
s
C
o
m
p
e
t
i
t
i
v
e
i
r
r
e
v
e
r
s
i
b
l
e
a
n
t
a
g
o
n
i
s
t
Antagonism
Types
Pharmacodynamic antagonism (Receptor-blockade
antagonism).
Non-Competitive
Antagonist block at some point the chain of events that
stimulate the response of agonist.
Agonist
and
Antagonist
can be bound simultaneously.
Antagonism cannot be overcome by increasing concentration of
agonist
e.g. verapamil and noradrenaline
.
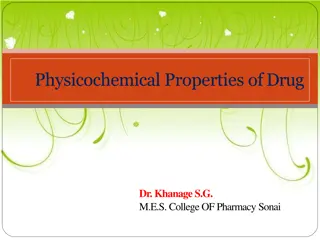
Explore the quantitative aspects of drug action, including drug receptor binding, concentration binding curves, dose-response curves, and types of antagonism. Learn to relate drug concentration to receptor binding capacity and response produced. Discover how concentration binding curves and dose-response curves provide insights into drug efficacy, affinity, and potency. Gain an understanding of concepts such as Bmax, KD, affinity, and the relationship between drug concentration and response.

Download Presentation

Please find below an Image/Link to download the presentation.
The content on the website is provided AS IS for your information and personal use only. It may not be sold, licensed, or shared on other websites without obtaining consent from the author.If you encounter any issues during the download, it is possible that the publisher has removed the file from their server.
You are allowed to download the files provided on this website for personal or commercial use, subject to the condition that they are used lawfully. All files are the property of their respective owners.
The content on the website is provided AS IS for your information and personal use only. It may not be sold, licensed, or shared on other websites without obtaining consent from the author.
E N D
Presentation Transcript
PHARMACODYNAMICS II QUANTITATIVE ASPECTS OF DRUGS QUANTITATIVE ASPECTS OF DRUGS Ali Alhoshani, B.Pharm, Ph.D. ahoshani@ksu.edu.sa Office: 2B 84
Quantitative aspects of drugs By the end of this lecture, you should: Determine quantitative aspects of drug receptor binding. Recognize concentration binding curves. Identify dose response curves and the therapeutic utility of these curves. Classify different types of antagonism.
QUANTIFY ASPECTS OF DRUG ACTION Initiate Activate Bind Occupy D + R D R DR* RESPONSE[R] Relate concentration [C] of D used (x- axis) to the binding capacity at receptors (y-axis) Relate concentration [C] of D used (x- axis) to response produced (y-axis) A Concentration-Binding Curve Dose Response Curves EFFICACY AFFINITY POTENCY
Concentration binding curves Is a correlation between drug concentration [C] used (x- axis) and drug binding capacity at receptors [B] (y-axis). i.e. relation between concentration & drug binding KD
Concentration binding curves (Bmax): Total density of receptors in the tissue KD KD (kD )= [C] of D required to occupy 50% of receptors at equilibrium
Concentration binding curves Bmax (the binding capacity) is the total density of receptors in the tissues KD50 is the concentration of drug required to occupy 50% of receptors at equilibrium. The affinity of drug for receptor The higher the affinity of D for receptor the lower is the KD i.e. inverse relation ( Binding Potential= Bmax/KD )
Dose -response curves Used to study how response varies with the concentration or dose. Is a correlation between drug concentration [D] used (x- axis) and drug response [R] (y-axis). i.e. relation between concentration & Response
Dose -response curves Type of Dose-response curves Graded dose-response curve Quantal dose-response curve (all or none).
Dose -response curves Type of Dose-response curves Graded dose-response curve Response is gradual Gradual increase in response by increasing the dose (continuous response). e.g. blood pressure, heart rate, blood glucose level, cholesterol,
Dose -response curves Type of Dose-response curves Graded dose-response curve Curve is usually sigmoid in shape Used to calculate Emax EC50 Potency Efficacy
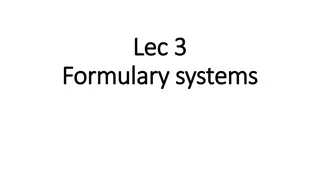
Dose -response curves- Graded Max effect = EmaxEffect when all the receptors are occupied by D 100 100 80 80 % of Maximal Effect % of Maximal Effect 60 60 40 40 20 20 0 0 0 EC50 200 400 600 800 1 10 100 1000 [C] [C] EC50 EC50 =C that gives the half-maximal effect
Dose -response curves Dose -response curves- Graded Used to determine Maximum Efficacy (Emax): is the maximal biological response produced by a drug. Median Effective concentration (EC50): is the concentration of the drug that gives 50% of the maximal response (Emax). Potency: the concentration of drug required to produce a specified response (50% of the maximal response = EC50). Potency: is inversely proportional to EC 50.
Dose -response curves Dose -response curves- Graded
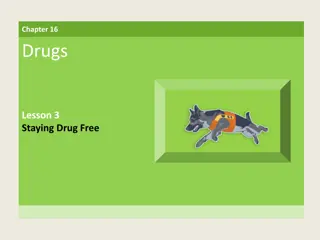
Dose -response curves Type of Dose-response curves Quantal dose-response curve Relate drug concentration to % percentage of patients responding (all or none response). The response may be therapeutic response, adverse effect or lethal effect. e.g. prevention of convulsion, arrhythmias or death. Used to determine ED50 TD50 & LD50 Therapeutic index.
Dose -response curves-Quantal 100 Lethal Effect % subjects responding 80 Toxic Effect Therapeutic Effect 60 40 LD50 20 ED50 TD50 [Dose] 0 1 10 100 1000 A. B. C. A. 50% of individuals exhibit the specified therapeutic response B. toxic effects C. death Predict the safety profile
Therapeutic Index (T.I.) A measure of drug safety The ratio of the dose that produces toxicity to the dose that produces a clinically desired or effective response in a population of individuals Therapeutic Index = TD50/ED50 or LD50/ED50 TD50 is the dose that produces a toxic effect in 50% of the population. LD50 is the dose that is lethal in 50% of the population ED50 is the dose that produces therapeutic response in 50% of the population Large value = drug has wide margin of safety e.g diazepam Small value = a narrow margin of safety e.g. digoxin
Therapeutic Index (T.I.) Therapeutic Window Therapeutic Index
Antagonism It is the decrease or the complete abolishment of the effect of one drug in the presence of another. Types Physiological antagonism Chemical antagonism Pharmacokinetic Pharmacodynamic antagonism (Receptor-blockade antagonism). Competitive Reversible Irreversible Non-competitive
Antagonism Types Physiological antagonism Two drugs act on different receptors to produce different physiological effects. e.g. Histamine & Adrenaline Adrenaline Vasoconstriction ( BP) & bronchodilation. Histamine vasodilatation ( BP) & bronchoconstriction
Antagonism Types Chemical antagonism Simple chemical reaction & loss of activity No receptor. e.g. Dimercaprol reduces heavy metal toxicity (as in lead toxicity).
Antagonism Types Pharmacokinetic The antagonist effectively reduces the concentration of the active drug at the site of action. e.g. Phenobarbitone accelerates hepatic metabolism of warfarin
Antagonism Types Pharmacodynamic antagonism (Receptor-blockade antagonism). Competitive Reversible Irreversible Non-Competitive
Antagonism Types Pharmacodynamic antagonism (Receptor-blockade antagonism). Competitive Reversible Two drugs compete for the same receptor. The antagonist partially or completely prevents the pharmacological effect of agonist. Antagonist dissociate rapidly from receptor. Antagonism can be overcome by increasing the concentration of the agonist. Parallel shift of the curve to the right, without any change in slope or maximum e.g. acetylcholine and atropine
Antagonism Types Pharmacodynamic antagonism (Receptor-blockade antagonism). Competitive Reversible
Antagonism Types Pharmacodynamic antagonism (Receptor-blockade antagonism). Competitive Irreversible Two drugs compete for the same receptor. Antagonist forms stable, permanent chemical bond with receptor. The original response can not be overcome even by increasing the dose of the agonist. No parallel shift A decrease in slope and a reduced maximum are obtained. e.g. phenoxybenzamine and noradrenaline.
Antagonism Competitive reversible antagonist vs Competitive irreversible antagonist
Antagonism Types Pharmacodynamic antagonism (Receptor-blockade antagonism). Non-Competitive Antagonist block at some point the chain of events that stimulate the response of agonist. Agonist and Antagonist can be bound simultaneously. Antagonism cannot be overcome by increasing concentration of agonist e.g. verapamil and noradrenaline.


")

")
")