sefa's Q1 Performance Report FY 2023/24 Presentation
sefa's Q1 performance report for the financial year 2023/24 highlights challenges such as economic constraints and internal operational issues affecting loan book performance. Despite these challenges, sefa has made efforts to drive performance and support SMEs. The report covers areas like organisational performance, balanced scorecard summary, loan book approvals, developmental impact, and financial performance.
Download Presentation

Please find below an Image/Link to download the presentation.
The content on the website is provided AS IS for your information and personal use only. It may not be sold, licensed, or shared on other websites without obtaining consent from the author.If you encounter any issues during the download, it is possible that the publisher has removed the file from their server.
You are allowed to download the files provided on this website for personal or commercial use, subject to the condition that they are used lawfully. All files are the property of their respective owners.
The content on the website is provided AS IS for your information and personal use only. It may not be sold, licensed, or shared on other websites without obtaining consent from the author.
E N D
Presentation Transcript
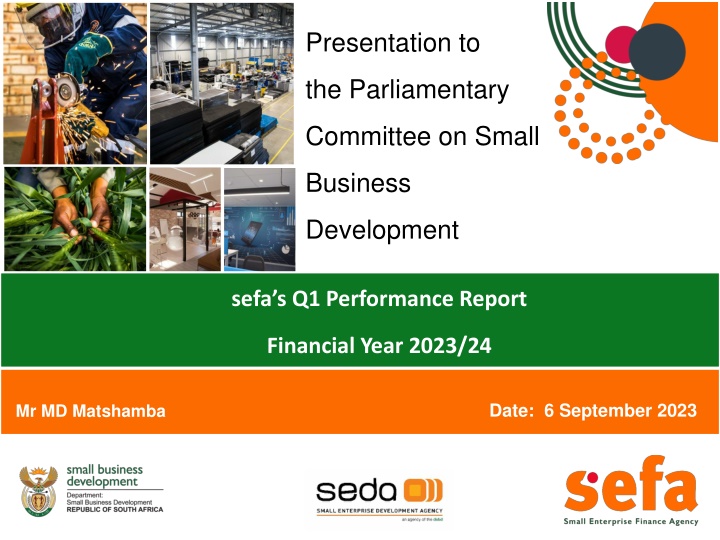
Presentation to the Parliamentary Committee on Small Business Development sefa s Q1 Performance Report Financial Year 2023/24 Date: 6 September 2023 Mr MD Matshamba
Presentation Outline 1 Organisational Performance Overview 2 Summary of the Balanced Scorecard 3 Commentary on Q1 Performance 4 Balanced Scorecard 5 Q1 Loan Book Approvals/Disbursement 6 Developmental Impact 7 Post Investment Monitoring 8 Financial Performance 9 Human Capital Management 10 Marketing & Communications 11 Organisational Governance 2
Overview of Quarter 1 Performance A low economic growth environment and structural impediments in the economy (i.e., continual interest rate increases over the last 18 months, increase in fuel and input costs, effects of load- shedding etc.) continue to have an adverse impact on the performance of the loan book. Internally sefa's operating environment is facing challenges such as the: o Forensic investigations that impacted on lending operations. o Pending merger and uncertainty among employees and impacting organisational culture and sustained performance, and o Employment conditions and sefa s inability to create a stable workforce resulting in leadership gaps, threat to business continuity, and loss of institutional memory. Increased perceptions of fraud risk in sefa have led to the negative sentiment on sefa s operating and control environment. Despite these challenges, sefa management has continued to arrest these challenges by driving performance and providing support as best as possible even though the causal effects are starting to threaten the performance of the organisation. Different measures are deployed to improve on the Quarter 1 performance to attain the annual set targets. 3
Summary of the Balanced Scorecard Small Enterprise Finance Agency (sefa) 1st quarter performance Total Loan Book R4,2 billion (including funds) Approvals 8 194 SMMES financed 14 572 jobs Total approvals for Q1 were R81 million Disbursements Total disbursements for the quarter were R385million . Black- owned R331M Township- based R67M Women- owned R130M Youth- owned R75M 4
Commentary on Q1 Performance Approvals: Developmental Impact: The disbursement to people with disabilities Underperformance mainly attributed to: continues to be a challenge due to the target Vacancies in strategic positions within which is not aligned to the market demand lending, credit, and legal divisions. for this target group. Enhanced TREP implementation process to Domino effect* from limited approvals. improve the quality of deals (i.e., consistent pre-funding site visits), Collections: Affected by tough trading conditions, namely, BCIC to approve WL deals above R15 million not held*, and (low growth, load-shedding, high input costs Suspension of disbursements from EU Fund & escalating fuel prices, and the overall (YCF & Wholesale Lending). weak demand as the cost-of-living rises), especially on DL clients. 5
Balanced Scorecard: Customer Perspective CUSTOMER PERSPECTIVE QUARTER ONE PERFOMANCE Q1 Q1 Q1 % OUTPUT OUTPUT INDICATORS 2023/24 ANNUAL TARGET Target Achieved Achieved Value of approvals to SMMEs and co-operatives (R 000) R2 339 752 R490 950 R80 550 16% Value of disbursements to SMMEs and co- operatives (R 000) R2 346 589 R482 540 R384 510 80% Number of SMMEs and co-operatives financed 93 671 9 686 8 149 84% Number of jobs facilitated and sustained 120 022 15 830 14 572 92% Disbursements to Black-owned enterprises (R 000) Disbursements to women-owned enterprises (R 000) Disbursements to youth-owned enterprises (R 000) R1 642 613 R337 778 R331 100 98% Broadened access to finance R938 636 R193 016 R129 777 67% R703 977 R144 762 R75 252 52% Disbursements to enterprises owned by entrepreneurs with disabilities (R 000) R164 261 R33 778 R1 688 5% Disbursements to township-based enterprises (R 000) R586 647 R120 635 R66 886 55% Disbursements to enterprises located in rural towns and villages (R 000) R938 636 R193 016 R122 391 63% Strategic stakeholder relations with key constituencies Number of leads generated 120 30 32 107% Development and approval of a Brand Visibility Index Improvement Plan Enhanced sefa brand visibility Annual Brand Visibility Index 60% Brand Visibility Index Annual Measurement 85% Customer Satisfaction Index rating Implement customer survey report recommendations Customer satisfaction Annual Customer Satisfaction Index rating Annual Measurement 6
Balanced Scorecard: Financial Perspective FINANCIAL PERSPECTIVE QUARTER 1 PERFORMANCE Q1 Q1 Q1 % OUTPUT OUTPUT INDICATORS 2023/24 ANNUAL TARGET Target Achieved Achieved Cost-to-income ratio (excluding impairments on loans, advances, and KCG claims provision I/S movement relating to the SSSP and Autobody Programme) 74% 74% 45.5% 131% Enhanced financial management and performance Percentage growth in revenue (excl. grant income and MTEF) 11% 11% 58% 527% Enhanced KCG financial management and performance KCG capital leveraging ratio 6.25 times 6.25 6.59 105% Lettable area vacancy rate (target 10%) 30% 40% 30% 74% Effectively managed property portfolio Rental collections rate 50% 45% 58% 129% Improved credit risk assessment and mitigation Blended first default rate 10% 10% 5.5% 182% Percentage Portfolio at Risk 45% 45% 63% 71% Accumulated impairment provision as a percentage of total loans and advances Enhanced loan portfolio performance 40% 40% 57.6% 81% Percentage collection rate (all-in cash collections) 85% 85% 74.50% 88% Capital raising R85 000 Not measured in Q1 Rand value of additional capital raised (R 000) BBEE evaluation conducted, and baseline established B-BBEE baseline established sefa B-BBEE facilitator status Annual Measurement sefa B-BBEE level Improvement Plan implemented Improvement Plan developed 7
Balanced Scorecard: Business Process BUSINESS PROCESS PERSPECTIVE QUARTER 1 PERFORMANCE Q1 Q1 Q1 % OUTPUT OUTPUT INDICATORS 2023/24 ANNUAL TARGET Target Achieved Achieved Number of client and funding partner interventions 190 45 38 84% SMME and intermediary institutional capacity building Number of sefa clients improving turnover by 5% 35 7 11 157% Turnaround time for Direct Lending (days) 30 30 65 46% Efficient and effective lending Turnaround time for Wholesale Lending (days) 50 50 No deals done Progress in implementation of an electronic crowd-funding platform for early- stage start-ups Specification for electronic crowdfunding early-stage start- ups developed Electronic crowd-funding platform for early- stage start-ups Detailed business case developed Annual Measurement Progress in automation of sefa business processes Maintenance and enhancement of the PIMWR system To-be enhancement requirements documented Annual Measurement Automation / digitisation of sefa business processes Progress in implementation of the sefa Enterprise Content Management System Phase 2 implementation of the ECM system To-be requirements documented Annual Measurement Implement improvement recommendations from the 2022/2023 assessment Enhanced risk maturity sefa risk maturity level Improve from level 3 to level 4 Annual Measurement 8
Balanced Scorecard: Learning & Growth LEARNING & GROWTH PERSPECTIVE QUARTERLY PERFORMANCE Q1 Q1 Q1 % OUTPUT OUTPUT INDICATORS 2023/24 ANNUAL TARGET Target Achieved Achieved 6 Sector and value chain analysis reports 1 Sector and value chain analysis report 1 Sector and value chain analysis report 100% Bi-annual business conditions survey Monitoring and evaluation of sefa loan programme performance and commissioning of strategic research projects Not measured in Q1 Number of publications produced Monitoring of Loan Programme Performance Report Loan Programme Performance Report Bi-annual measurement 70% Employee Engagement Index (EEI) Employee Engagement Survey Completed Employee Engagement Index (EEI) Annual Measurement Improved employee engagement Improvement of organisational performance Achievement of 60%of staff with scores of 3.5 and more on FY 2022/23 annual performance Percentage of staff that scores 3.5 or more in the annual performance assessment 60% Staff that scores 3.5 or more in the 2022/23 annual performance assessment Annual Measurement Achievement of quarterly divisional productivity targets Productivity Index increases by 10% from baseline Productivity improvement Productivity Index Annual Measurement 9
Q1 Loan Book Approvals /Disbursements by Channel The total loan book disbursements for Q1 were R385 million against the quarterly target of R483 million, representing 80% of the quarterly target. DL disbursements were R131 million (63% of quarterly target) WL loan program disbursed R253 million. o WL SME disbursed R71 million (45% of the quarterly target) o Microfinance disbursed R23,6 million (60% of quarterly target) o KCG taken ups amounted to R159 million. (211% of quarterly target) The total loan book approvals for quarter 1 were R81 million against a target of R491 million, representing 16% of the quarterly target. The quarterly approvals comprise o R76,4 million for DL and o R4 million for KCG. The DL approvals were driven mainly by the implementation of the Economic Recovery Programme (R32 million). 10
Development Impact: Targeted Groups Annual Target Q1 Target Q1 Achieved % Achieved Youth (R'000) 52% 75 252 703 977 144 762 People with Disability (R'000) 5% 1688 164 261 33 778 Women owned (R'000) 67% 129 777 938 636 193 016 Black owned (R'000) 98% 331 100 1 642 613 337 778 Villages & Rural towns (R'000) 63% 122 391 938 636 193 016 55% 66 886 Townships (R'000) 120 635 586 647 11
Spatial Distribution of Loan Disbursements Province SMME's Disbursement 230 63 232 2604 3379 1526 R19 202 988 R4 125 096 R131 052 922 R55 819 767 R49 369 494 R40 034 295 R4 891 511 R24 347 468 R55 666 734 Eastern Cape Free State Gauteng KwaZulu Natal Limpopo Mpumalanga Northern Cape North West Western Cape LP 12.8% GP 34.1% NW 6.3% MP 10.4% 8 FS 1.1% 43 64 NC 1.3% 8149 R384 510 275 Total EC 5% WC 14.5% In value terms, majority of sefa s disbursements were done in Gauteng followed by KwaZulu Natal and Western Cape. The majority of SMMEs supported in Limpopo, KwaZulu Natal and Mpumalanga were through sefa s Micro Finance and Informal sector loan programme. The total number of small businesses financed comprises of the following loan programmes: Informal and Microfinance programme (88%), DL (1%), WL SME (3,3%) & KCG (7,2%) . 12
Post Investment Monitoring: Portfolio Composition Direct Lending (R'm) R2 831 2023-2024 (Q1) R1 378 Wholesale Lending (R'm) Total (R'm) R4 209 R2 746 Direct Lending (R'm) 2022-2023 (Q4) R1 443 Wholesale Lending (R'm) Total (R'm) R4 188 R 0 R1 000 R2 000 R3 000 R4 000 R5 000 Millions As at 30 June 2023, the portfolio had a total balance of R4.2bn (Including funds) made up of: o Wholesale Lending at R1.38bn (33%) and R2.8bn (67%) in Direct Lending. The WL book has reduced by 4.7% (R65m) quarter on quarter. DL book has increased by 3% (R86m) quarter on quarter. 13
Post Investment Monitoring: Portfolio At Risk Total R2,211 R3,966 * Wholesale Lending R428 R1,135 Direct Lending R1,783 R2,831 R0 R500 R1,000 R1,500 R2,000 R2,500 R3,000 R3,500 R4,000 R4,500 R Millions Percentage Portfolio at Risk Outstanding Balance * Outstanding balance excludes equities. The overall Portfolio at Risk increased to 55.7% in Q1 from 48.6% in Q1 (target 42%) The PAR for WL was 37.7% in WL and 63.0% in DL. The DL PAR increased by 7.6% to 63% (Q4:55.4%). The WL PAR increased by 4.9% to 37.7% (Q4:32.8%). o The sefa products with the largest contribution to PAR in Q1 were SEMSP with an increase of 4% to 35% from 31% in Q4, Direct Loans with 7% to 69% from 62% in Q4, and TREP by 10% to 74% from 64% in Q4. These three products translate to 79% of the total outstanding sefa loan book. o The increase in PAR resulted from economic challenges facing clients, such as load shedding (operating a few hours and increased cost of doing business) and high inflation. o This has resulted in businesses struggling to keep up with their monthly sefa repayments and hence the increase in arrears. 14
Total Collections Q1 the combined collection rate of 74.5% was achieved against a target of 85%. Direct lending continues to struggle with collections with both metrics of on-time and all-in rate. o Our clients are experiencing several economic challenges which make it difficult for them to keep up with o their monthly repayment obligations. 15
Financial Performance Strategic Indicator Annual Target Q1 Achieved Cost-to-income ratio before impairments* 74% 57.6% Accumulated Impairment provision as a percentage of total loans and advances (excluding Direct Lending disbursement prior to the 1st of April 2016) ** Percentage Growth in Revenue (excl. Grant income and MTEF) 40% 45.5% 11% 58% a. The year-to-date Cost to Income ratio for the quarter is 57.6% and this is favourable compared to the annual corporate plan target of 74%. b. The favourable variance is due to the savings noted under personnel expenses, technical reserve movements not yet finalised for Q1, investment properties expenses and other operating expenses have also resulted in a lower cost-to- income ratio for the period. c. The interest on lending operations and the investment income were higher than budgeted. The interest from lending operations for the year-to-date amounted to R46.4 million against a budget of R43.8 million, resulting in a slight positive variance of 6%. The investment income was R22.6 million more than budgeted (56% above budget) due to the higher interest rates than budgeted d. Adverse impact on impairments resulted from The high inflation and the effects of loadshedding have negatively affected our clients. The increased cost of inputs have affected the businesses' viability and affordability of the sefa loans. The businesses are unable to reach their potential revenues because of fewer trading hours as a result of load- shedding. * Cost to income ratios exclude finance charges on the IDC loan, impairments and income tax and includes the MTEF allocation. ** Accumulated Impairment provision excluding Direct Lending disbursement prior to the 1st of April 2016 16
Human Capital and Facilities Management Employee Engagement Index The EE Survey Report was presented to EXCO and HCRC and action plans are being designed. Productivity Index increased by 10% the from baseline. sefa has developed a productivity measurement programme, which will be supported by a system. This productivity measurement framework was tabled and approved by the HCRC during the reporting period. Culture integration through values alignment sefa s one-culture project is underway, to be supported by a service provider to conduct culture integration in preparation for the merger. Leadership and Management Development The Certificate in Banking Learnership commenced in March 2023. The Junior/Middle Management Development Programme is underway and will conclude in July 2023. The third intake Management Development Programme will commence in Q3. Provision of healthy and safe working environment The maintenance of office spaces is ongoing. Finalised the office infrastructure requirements of the KZN and Mthatha offices. They are all operational. 17
Marketing and Communications Brand Management, Marketing & Internal Communications Stakeholder Management Practice Media Relations (PR & Advertising) sefa continued with the billboard campaign in six provinces Live Youth engagement sessions were hosted in Mpumalanga and Limpopo for Youth Challenge Fund, Production of 2 issues of the sefaZen Internal Digi Mag sefa was featured 8 times on various media platforms radio, online and print A stakeholder engagement session was hosted at University of Sol Plaatjie & Matjabeng Parliamentary outreach was supported. An engagement session with South African Military Veteran Association was held during the quarter. 18
Governance (Key Decisions) Audit Committee a) APPROVED the Khula Credit Guarantee (KCG) Management Accounts for Q4 FY2022/23 and RECOMMENDED them for noting by the KCG Board. b) APPROVED the Khula Business Premises (KBP) Management Accounts for Q4FY2022/23 and RECOMMENDED them for noting by the KBP Board. c) APPROVED the sefa Management Accounts for Q4FY2022/23 and RECOMMENDED them for noting by the sefa Board. d) APPROVED the draft Annual Financial Statements FY2022/23 for the sefa Group and sefa Company for submission to the External Auditors and the Shareholder, Industrial Development Corporation. e) APPROVED the Internal Audit Charter and the Internal Audit Plan for FY20223/24. f) APPROVED the External Audit Planning Memorandum and Audit Fees Budget for the FY2022/23 Audit. Board of Directors a) APPROVED the Q4FY2022/23 Performance Report for submission to the DSBD and authorised the Acting Chairperson, to sign the Report on behalf of the Board. b) APPROVED the Preliminary Report to the Portfolio Committee on its North West Oversight Site Visit c) APPROVED the sefaShareholder s Compact FY2023/24 for submission to the Shareholder, IDC, in line with the applicable governance process. d) APPROVED the Addendum to the Ernst & Young Scope of Work to include the investigation into a sefa funded intermediary approved in December 2021. e) APPROVED the reconstitution of the Board Committees and Chairpersons f) NOMINATED Dr MJ Qobo, in his capacity as the Interim Board Chairperson as a Non-Executive Director of Business Partners Limited, where the Company has 22% shareholding. 5 2 19
Governance (cont.) Credit and Investment Committee Meetings a) There were no Board Credit and Investment Committee Meetings held. b) The Shareholder is being engaged for the appointment of a chairperson in line with the IDC governance framework. Arrangements are underway to appoint an interim chairperson pending the IDC process. Social and Ethics Committee Meeting a) There were no decisions taken. b) The Committee considered the quarterly management activities reports within its mandate. 1 0 1 1 Risk Committee a) APPROVED the KCG Annual Risk and Compliance Implementation Plan for FY2023/24 and RECOMMENDED it for noting by the KCG Board. b) RECOMMENDED the Risk and Compliance Management Programme for approval by the Board of Directors. Human Capital & Remuneration Committee a) RECOMMENDED the Employee Wellness Policy to the sefa Board of Directors. b) APPROVED the Productivity Measurement Framework. c) APPROVED the appointment of an Interim Executive Manager: Post Investment Monitoring & Workouts, 20
Thank You! 21
REACH OUT Department of Small Business Development 77 Meintjies Street Sunnyside Pretoria 0001 +27 861 843 384 info@dsbd.gov.za www.dsbd.gov.za Small Enterprise Development Agency The Fields, Office Block A 1066 Burnett Street Hatfield Pretoria 0833 +27 12 441 1000 info@seda.gov.za www.seda.org.za Small Enterprise Finance Agency Byls Bridge Office Park, Cnr Olievenhoutbosch Street & Jean Avenue, Building 14 , Block D 11 Byls Bridge Boulevard Highveld Extension 73 Centurion 0157 +27 12 748 9600 helpline@sefa.org.za www.sefa.org.za 25
