Research Proposal: Objectives and Results Evaluation
This research proposal presentation focuses on outlining the objectives, methodology, and results of a doctoral study, providing insights into the project's progression and outcomes. It covers various objectives and their corresponding methodologies and results to evaluate the effectiveness and achievements of the research endeavor.
Download Presentation

Please find below an Image/Link to download the presentation.
The content on the website is provided AS IS for your information and personal use only. It may not be sold, licensed, or shared on other websites without obtaining consent from the author.If you encounter any issues during the download, it is possible that the publisher has removed the file from their server.
You are allowed to download the files provided on this website for personal or commercial use, subject to the condition that they are used lawfully. All files are the property of their respective owners.
The content on the website is provided AS IS for your information and personal use only. It may not be sold, licensed, or shared on other websites without obtaining consent from the author.
E N D
Presentation Transcript
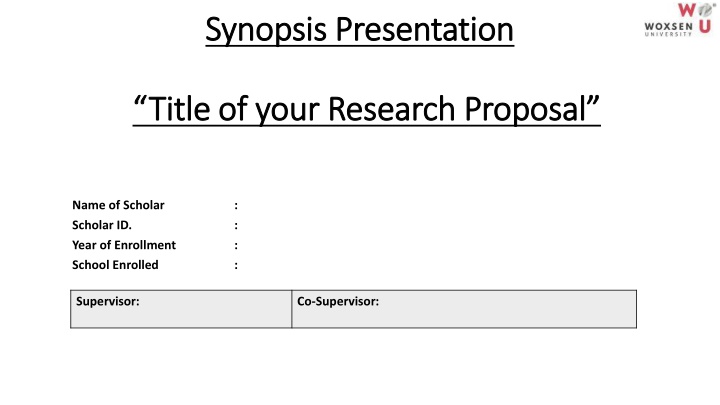
Synopsis Presentation Synopsis Presentation Title of your Research Proposal Title of your Research Proposal Name of Scholar Scholar ID. Year of Enrollment School Enrolled : : : : Supervisor: Co-Supervisor:
Doctoral Study Status Course Work Status: No. of Research Publications: No. of Workshops Attended: No. of Conference Attended:
Research Publications Journal Articles Sl.No Authors (list all authors present in the article) Title of Paper Title of Journal Indexing Justification for presence of other authors
Research Publications Any Other Research Contributions Categ ory Authors (list all authors present in the article) Title of Paper Name of Conference/Book Organized BY Justification for presence of other authors Book Chapter Conferen ce Proceedin g
Conclusion Use a conclusion slide to: Summarize the main points of your presentation Suggest future avenues of research
Slide Structure Plan for about 1.5-2 minutes per slide in your presentation Write in point form, not complete sentences, i.e., use key words and phrases Not everything needs to be presented: choose material to be put on slides Slides should be un-cluttered and use bullets where necessary
Graphs Use graphs rather than charts and words Data in graphs is easier to comprehend and retain than is raw data Trends are easier to visualize in graphical form Always title your graphs
