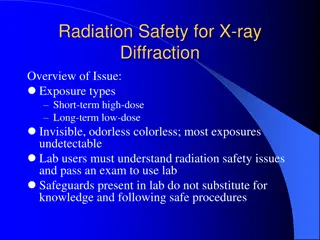
Radiation Damage in Crystallography


Maximum Data Quality Workshop
Made possible by:
UC Office of the President, Multicampus
Research Programs and Initiatives (MRPI)
grant MR‐15‐328599
R
A
D
I
A
T
I
O
N
D
A
M
A
G
E
!
W
h
a
t
y
o
u
n
e
e
d
t
o
k
n
o
w

Damage is done
by
dose (MGy)
proportional to photons/area
not time
not heat
S
l
i
z
P
,
H
a
r
r
i
s
o
n
S
C
&
R
o
s
e
n
b
a
u
m
G
(
2
0
0
3
)
.
S
t
r
u
c
t
u
r
e
1
1
,
1
3
-
1
9
.
G
a
r
m
a
n
E
F
&
M
c
S
w
e
e
n
e
y
S
M
(
2
0
0
6
)
.
J
.
S
y
n
c
.
R
a
d
.
1
4
,
1
-
3
.
O
w
e
n
R
L
,
R
u
d
i
n
o
-
P
i
n
e
r
a
E
&
G
a
r
m
a
n
E
F
(
2
0
0
6
)
.
P
N
A
S
1
0
3
,
4
9
1
2
-
4
9
1
7
.
L
e
i
r
o
s
e
t
a
l
.
(
2
0
0
6
)
.
A
c
t
a
C
r
y
s
t
.
D
6
2
,
1
2
5
-
1
3
2
.
H
o
l
t
o
n
J
M
(
2
0
0
7
)
.
J
.
S
y
n
c
h
R
a
d
.
1
4
,
5
1
-
7
2
.
H
o
l
t
o
n
(
2
0
0
9
)
J
.
S
y
n
c
h
r
o
t
r
o
n
R
a
d
.
1
6
1
3
3
-
4
2
Radiation Damage World Records
MGy
reaction
reference
~45
global damage
Owen
et al.
(2006)
10/Å
global damage
Howells et al. (2009)
5
Se
-
Met
Holton (2007)
4
Hg
-
S
Ramagopal
et al.
(2004)
4
R-C
-
COOH
Garman et al. (2015)
3
S
-
S
Murray
et al.
(2002)
1
Br
-
RNA
Olieric
et al.
(2007)
~1?
Cl
-
C
???
0.5
Mn
in
PS II
Yano
et al.
(2005)
0.06
putidaredoxin
Corbett
et al.
(2007)
0.02
Fe
in
myoglobin
Denisov
et al.
(2007)
http://bl831.als.lbl.gov/
damage_rates.pdf
H
o
l
t
o
n
J
.
M
.
(
2
0
0
9
)
J
.
S
y
n
c
h
r
o
t
r
o
n
R
a
d
.
1
6
1
3
3
-
4
2
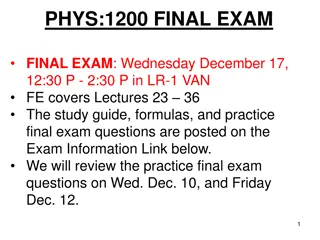
what the is a MGy?
How long will my crystal last?
synch line type flux beamsize flux density dose max xtal min site
ph/s
μ
m ph/
μ
m2/s rate lifetime lifetime
ALS 4.2.2 MAD 1e12 75x80 1.7e+08 124 kGy/s 4 m 16 s
ALS 5.0.1 mono 2e11 100 2.5e+07 13 kGy/s 39 m 2.6 m
ALS 5.0.2 MAD 1.5e12 100 1.5e+08 76.3 kGy/s 6.6 m 26 s
ALS 5.0.3 mono 3e11 100 3.8e+07 19.4 kGy/s 26 m 1.7 m
ALS 8.2.1 MAD 3.5e11 100 4.5e+07 22.7 kGy/s 22 m 88 s
ALS 8.2.2 MAD 3.5e11 100 4.5e+07 22.7 kGy/s 22 m 88 s
ALS 8.3.1 MAD 9e11 70 2.3e+08 119 kGy/s 4.2 m 17 s
ALS 12.3.1 MAD 2e11 65x90 3.4e+07 17.4 kGy/s 29 m 1.9 m
ALS 12.3.1 ML 4.0e13 65x90 6.8e+09 6.89 MGy/s 4.4 s 0.29 s
SSRL 1-5 MAD 1.7e10 200 4.2e+05 202 Gy/s 41 h 2.8 h
SSRL 7-1 mono 2.6e11 200 6.5e+06 3.09 kGy/s 2.7 h 11 m
SSRL 9-1 mono 3.9e10 200 9.8e+05 463 Gy/s 18 h 72 m
SSRL 9-2 MAD 4.8e11 200 1.2e+07 5.7 kGy/s 88 m 5.8 m
SSRL 11-1 MAD 3.9e11 200 9.8e+06 4.63 kGy/s 1.8 h 7.2 m
SSRL 11-3 mono 2.6e10 200 6.5e+05 302 Gy/s 28 h 1.8 h
SSRL 12-2 MAD 4e12 90x5 8.9e+09 5.01 MGy/s 6 s 0.4 s
SSRL 12-1 MAD 4e12 5x5 1.6e+11 90 MGy/s 0.35 s 22 ms
SSRL 12-1 ML
3e14 5x5 1.1e+13 6.4 GGy/s 5 ms 300 us
APS 24-ID-C MAD 1.3e13 20x60 1.1e+10 5.23 MGy/s 5.7 s 0.38 s
APS "typical" MAD 1.5e12 80 2.3e+08 119 kGy/s 4.2 m 17 s
synch line type flux beamsize flux density dose max xtal min site
ph/s
μ
m ph/
μ
m2/s rate lifetime lifetime
H
o
l
t
o
n
&
F
r
a
n
k
e
l
(
2
0
1
0
)
A
c
t
a
D
6
6
3
9
3
-
4
0
8
.
Where:
I
DL
- average damage-limited intensity (photons/hkl) at a given resolution
10
5
- converting
R
from μm to m,
r
e
from m to Å,
ρ
from g/cm
3
to kg/m
3
and MGy to Gy
r
e
- classical electron radius (2.818 x 10
-15
m/electron)
h
- Planck’s constant (6.626 x 10
-34
J∙s)
c
- speed of light (299792458 m/s)
f
decayed
- fractional progress toward completely faded spots at end of data set
ρ
- density of crystal (~1.2 g/cm
3
)
R
- radius of the spherical crystal (μm)
λ
- X-ray wavelength (Å)
f
NH
- the Nave & Hill (2005) dose capture fraction (1 for large crystals)
n
ASU
- number of proteins in the asymmetric unit
M
r
- molecular weight of the protein (Daltons or g/mol)
V
M
- Matthews’s coefficient (~2.4 Å
3
/Dalton)
H
- Howells’s criterion (10 MGy/Å)
θ
- Bragg angle
a
2
-
number-averaged squared structure factor per protein atom (electron
2
)
M
a
- number-averaged atomic weight of a protein atom (~7.1 Daltons)
B
- average (Wilson) temperature factor (Å
2
)
μ
- attenuation coefficient of sphere material (m
-1
)
μ
en
- mass energy-absorption coefficient of sphere material (m
-1
)
Self-calibrated damage limit
H
o
l
t
o
n
&
F
r
a
n
k
e
l
(
2
0
1
0
)
A
c
t
a
D
6
6
3
9
3
-
4
0
8
.
No flux
No symmetry
C
r
y
s
t
a
l
d
i
a
m
e
t
e
r
(
m
i
c
r
o
n
)
R
e
s
o
l
u
t
i
o
n
(
Å
)
B
=
0
B
=
2
0
B
=
6
0
B
=
1
7
0
B
=
3
3
0
B
=
5
6
0
B
=
8
5
0
Bigger is better, but not by much
B factor from image analysis
B
=
5
0
0
B factor from image analysis
B
=
2
0
Can radiation damage be
“outrun”?
Dose-rate effect at Room Temp?
W
a
r
k
e
n
t
i
n
M
,
B
a
d
e
a
u
R
,
H
o
p
k
i
n
s
J
B
,
M
u
l
i
c
h
a
k
A
M
,
K
e
e
f
e
L
J
&
T
h
o
r
n
e
R
E
(
2
0
1
2
)
.
"
G
l
o
b
a
l
r
a
d
i
a
t
i
o
n
d
a
m
a
g
e
a
t
3
0
0
a
n
d
2
6
0
K
w
i
t
h
d
o
s
e
r
a
t
e
s
a
p
p
r
o
a
c
h
i
n
g
1
M
G
y
s
-
1
"
,
A
c
t
a
C
r
y
s
t
.
D
6
8
,
1
2
4
-
1
3
3
.
O
w
e
n
R
L
,
A
x
f
o
r
d
D
,
N
e
t
t
l
e
s
h
i
p
J
E
,
O
w
e
n
s
R
J
,
R
o
b
i
n
s
o
n
J
I
,
M
o
r
g
a
n
A
W
,
D
o
r
e
A
S
,
L
e
b
o
n
G
,
T
a
t
e
C
G
,
F
r
y
E
E
,
R
e
n
J
,
S
t
u
a
r
t
D
I
&
E
v
a
n
s
G
(
2
0
1
2
)
.
"
O
u
t
r
u
n
n
i
n
g
f
r
e
e
r
a
d
i
c
a
l
s
i
n
r
o
o
m
-
t
e
m
p
e
r
a
t
u
r
e
m
a
c
r
o
m
o
l
e
c
u
l
a
r
c
r
y
s
t
a
l
l
o
g
r
a
p
h
y
"
,
A
c
t
a
C
r
y
s
t
.
D
6
8
,
8
1
0
-
8
1
8
.
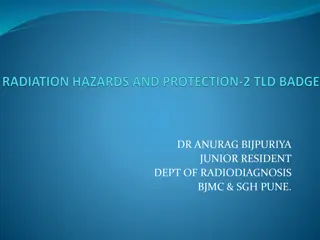
Dose-rate dependence of damage
d
o
s
e
r
a
t
e
(
k
G
y
/
s
)
m
a
x
i
m
u
m
u
s
e
f
u
l
d
o
s
e
(
M
G
y
)
Pilatus pile-up for RT MX?
same photons, different speeds
Sum of 193 shots with
193-fold attenuation
SLOW
Pilatus pile-up for RT MX?
same photons, different speeds
1 shot with
no attenuation
FAST
Pilatus pile-up for RT MX?
same photons, different speeds
Pilatus pile-up for RT MX?
same photons, different speeds
0.016° mosaic
Pilatus pile-up for RT MX?
same photons, different speeds
20 deg/s
0.016 deg mosaic
Pilatus pile-up for RT MX?
same photons, different speeds
Do we expect this with protein?
•
Mosaic spread (
η
) < 0.02°
•
20°/s rotation
•
50x50x50
μ
m lysozyme crystal
•
I
still
= 0.07*(F/mosaic)
2
•
F=130 → 3e6 photons/s/spot
•
Max Eiger count rate = 3e6 photons/s/spot
•
35% of Fs > 130 (lysozyme @ 2.0 Å)
•
45% under-counting expected
What is a “streak camera”?
What is a “streak camera”?
Individual spots at 768 kGy/s
Intensity (photons)
Dose (kGy)
0
Same xtal, different spots
Double-tap: no dark progression at 675 kGy/s
Intensity (photons)
Dose (kGy)
Xtal5_t1 graph
How much H
2
are we making?
•
Meents et al. (2010) claimed:
"400 molecules of H2 for every 12.5 keV photon“
= 3.3x10
-7
mol/J
•
200 kGy to 100 um
3
= 0.24 J
= 1.2x10
-8
mol H
2
•
100 um
3
of water = 6.7x10
-8
mol
→
18%
of water has reacted!
The number of
photons
scattered
before crystal is dead
i
s
i
n
d
e
p
e
n
d
e
n
t
of flux & time
1 um
3
= 10
5
photons (roomT)
1 um
3
= 10
6
photons
(synch)
1 um
3
= 10
8
photons (XFEL)
Henderson, 1990; Gonzalez & Nave, 1994; Glaeser
et al.
, 2000; Sliz
et al.
, 2003; Leiros
et al.
, 2006; Owen
et al.
, 2006; Garman & McSweeney, 2006; Garman & Nave, 2009;
Holton, 2009
(synch)
Dose slicing
crystal’s useful life
N
photons
N
photons
N
photons
unacceptable
completeness
unacceptable
read noise
Dose slicing: is that a spot?
Dose slicing: is that a spot?
Dose slicing: is that a spot?
Dose slicing: is that a spot?
Dose slicing: is that a spot?
Dose slicing: is that a spot?
Adding images
% cat << EOF > MERGE2CBF.INP
NAME_TEMPLATE_OF_DATA_FRAMES= /data/you/weak_?????.cbf
DATA_RANGE= 1 10
NAME_TEMPLATE_OF_OUTPUT_FRAMES=/data/you/sum_???.cbf
NUMBER_OF_DATA_FRAMES_COVERED_BY_EACH_OUTPUT_FRAME= 10
EOF
%
m
e
r
g
e
2
c
b
f
W
h
i
c
h
i
s
b
e
t
t
e
r
?
:
% xds_runme.com /data/you/weak_?????.cbf
% xds_runme.com /data/you/sum_?????.cbf
What if?
•
You only have a few small crystals…
Should you:
a)
Collect 360° from each?
b)
Collect 10° from each at 36x exposure?
c)
Glue 36 xtals together, then collect 360° ?
d)
Glue, and do 12960° faint exposures?
R
e
s
o
l
u
t
i
o
n
(
Å
)
C
C
v
s
r
i
g
h
t
a
n
s
w
e
r
“true” resolution limit
“true” resolution vs strategy
301,640,334 photons/xtal
Optimum exposure time?
~1 photon/pixel
XDS, DIALS
~10 photon/pixel
HKL2000, MOSFLM
~30 photon/pixel
CCD detector
Adding images
% cat << EOF > MERGE2CBF.INP
NAME_TEMPLATE_OF_DATA_FRAMES= /data/you/weak_?????.cbf
DATA_RANGE= 1 10
NAME_TEMPLATE_OF_OUTPUT_FRAMES=/data/you/sum_???.cbf
NUMBER_OF_DATA_FRAMES_COVERED_BY_EACH_OUTPUT_FRAME= 10
EOF
%
m
e
r
g
e
2
c
b
f
W
h
i
c
h
i
s
b
e
t
t
e
r
?
:
% xds_runme.com /data/you/weak_?????.cbf
% xds_runme.com /data/you/sum_?????.cbf
But my reviewer says…
R
merge
in high-resolution bin is >100% !
Answer: this is expected
Expected R
merge
as
I
obs
→ 0
A
v
e
r
a
g
e
v
a
l
u
e
Averaging Gaussian error
N
u
m
b
e
r
o
f
s
a
m
p
l
e
s
a
v
e
r
a
g
e
d
A
v
e
r
a
g
e
v
a
l
u
e
Averaging Gauss/Gauss error
N
u
m
b
e
r
o
f
s
a
m
p
l
e
s
a
v
e
r
a
g
e
d
A
v
e
r
a
g
e
o
u
t
e
r
-
s
h
e
l
l
R
m
e
r
g
e
R
merge
at the resolution limit in PDB
Y
e
a
r
Take-home lesson:
R factors are
undefined
as
I
obs
→ 0
Report as “ – “ in outer bin
Optimum resolution cutoff is:
•
Too optimistic: add nothing but noise
•
Too pessimistic: series-termination error
•
Happy medium?
•
Simulate:
–
Random atoms, compute F
2
–
Add Gaussian noise, RMS = 1
–
Truncate
–
Subtract “right” map, RMS difference
R
e
s
o
l
u
t
i
o
n
c
u
t
o
f
f
(
Å
)
E
r
r
o
r
i
n
m
a
p
(
r
m
s
e
-
)
Optimal resolution cutoff
R
e
s
o
l
u
t
i
o
n
c
u
t
o
f
f
(
Å
)
C
o
r
r
e
l
a
t
i
o
n
C
o
e
f
f
i
c
i
e
n
t
Optimal resolution cutoff
R
e
s
o
l
u
t
i
o
n
c
u
t
o
f
f
(
Å
)
C
o
r
r
e
l
a
t
i
o
n
C
o
e
f
f
i
c
i
e
n
t
Optimal resolution cutoff
l
o
g
(
i
n
t
e
n
s
i
t
y
)
Wilson Plot
2
.
2
1
.
6
1
.
3
1
.
1
1
.
0
0
.
9
0
.
8
5
0
.
8
0
.
7
5
0
.
7
r
e
s
o
l
u
t
i
o
n
(
Å
)
8
2
Optimum resolution cutoff is:
0.0 Å
E
l
e
c
t
r
o
n
d
e
n
s
i
t
y
(
e
-
/
Å
)
optical definition of resolution
P
o
s
i
t
i
o
n
(
Å
)
E
l
e
c
t
r
o
n
d
e
n
s
i
t
y
(
e
-
/
Å
)
optical definition of resolution
P
o
s
i
t
i
o
n
(
Å
)
E
l
e
c
t
r
o
n
d
e
n
s
i
t
y
(
e
-
/
Å
)
optical definition of resolution
P
o
s
i
t
i
o
n
(
Å
)
E
l
e
c
t
r
o
n
d
e
n
s
i
t
y
(
e
-
/
Å
)
optical definition of resolution
P
o
s
i
t
i
o
n
(
Å
)
E
l
e
c
t
r
o
n
d
e
n
s
i
t
y
(
e
-
/
Å
)
optical definition of resolution
P
o
s
i
t
i
o
n
(
Å
)
E
l
e
c
t
r
o
n
d
e
n
s
i
t
y
(
e
-
/
Å
)
optical definition of resolution
P
o
s
i
t
i
o
n
(
Å
)
E
l
e
c
t
r
o
n
d
e
n
s
i
t
y
(
e
-
/
Å
)
optical definition of resolution
P
o
s
i
t
i
o
n
(
Å
)
E
l
e
c
t
r
o
n
d
e
n
s
i
t
y
(
e
-
/
Å
)
optical definition of resolution
P
o
s
i
t
i
o
n
(
Å
)
E
l
e
c
t
r
o
n
d
e
n
s
i
t
y
(
e
-
/
Å
)
optical definition of resolution
P
o
s
i
t
i
o
n
(
Å
)
E
l
e
c
t
r
o
n
d
e
n
s
i
t
y
(
e
-
/
Å
)
optical definition of resolution
map sharpening
P
o
s
i
t
i
o
n
(
Å
)
E
l
e
c
t
r
o
n
d
e
n
s
i
t
y
(
e
-
/
Å
)
optical definition of resolution
realistic
map sharpening
P
o
s
i
t
i
o
n
(
Å
)
E
l
e
c
t
r
o
n
d
e
n
s
i
t
y
(
e
-
/
Å
)
optical definition of resolution
P
o
s
i
t
i
o
n
(
Å
)
A
t
o
m
i
c
R
e
s
o
l
u
t
i
o
n
(
Å
)
“3
σ
resolution” of model from map
r
e
f
i
n
e
d
a
t
o
m
i
c
B
f
a
c
t
o
r
(
8
π
u
x
2
)
R
M
S
m
a
p
e
r
r
o
r
(
e
-
/
Å
3
)
ATOM 122 N LEU A 13 -3.244 25.808 19.998 1.00 16.96 N
ATOM 123 CA LEU A 13 -2.877 25.448 21.355 1.00 15.29 C
ATOM 124 C LEU A 13 -2.792 23.966 21.561 1.00 17.54 C
ATOM 125 O LEU A 13 -1.814 23.493 22.143 1.00 16.35 O
ATOM 126 CB LEU A 13 -3.907 26.164 22.268 1.00 18.72 C
ATOM 127 CG LEU A 13 -3.577 25.982 23.738 1.00 21.19 C
ATOM 128 CD1 LEU A 13 -2.283 26.820 24.019 1.00 19.43 C
ATOM 129 CD2 LEU A 13 -4.702 26.474 24.639 1.00 24.65 C
ATOM 130 N SER A 14 -3.677 23.149 20.979 1.00 15.96 N
ATOM 131 CA SER A 14 -3.646 21.711 21.061 1.00 18.26 C
ATOM 132 C SER A 14 -2.373 21.203 20.360 1.00 18.71 C
ATOM 133 O SER A 14 -1.747 20.315 20.930 1.00 17.47 O
ATOM 134 CB SER A 14 -4.875 21.077 20.419 1.00 17.62 C
ATOM 135 OG ASER A 14 -4.825 19.665 20.388 0.50 20.89 O
ATOM 136 OG BSER A 14 -6.027 21.408 21.164 0.50 18.67 O
ATOM 137 N LYS A 15 -2.045 21.772 19.215 1.00 18.03 N
ATOM 138 CA LYS A 15 -0.799 21.361 18.555 1.00 18.12 C
ATOM 139 C LYS A 15 0.446 21.707 19.351 1.00 18.81 C
ATOM 140 O LYS A 15 1.400 20.948 19.411 1.00 17.77 O
ATOM 141 CB LYS A 15 -0.700 22.034 17.177 1.00 14.49 C
ATOM 142 CG LYS A 15 -1.727 21.368 16.256 1.00 16.12 C
ATOM 143 CD LYS A 15 -1.663 22.147 14.936 1.00 19.40 C
ATOM 144 CE ALYS A 15 -2.725 21.614 13.986 0.50 17.42 C
ATOM 145 CE BLYS A 15 -1.750 21.211 13.750 0.50 17.01 C
ATOM 146 NZ ALYS A 15 -2.346 21.674 12.559 0.50 18.61 N
ATOM 147 NZ BLYS A 15 -3.052 20.513 13.741 0.50 18.76 N
B factors are in the PDB file
Number of columns, rows, sections ............... 160 132 264
Map mode ........................................ 2
Start and stop points on columns, rows, sections 0 159 0
131 0 263
Grid sampling on x, y, z ........................ 132 160 264
Cell dimensions ................................. 43.0000
52.6100 89.1200 90.0000 90.0000 90.0000
Fast, medium, slow axes ......................... Y X Z
Minimum density ................................. -0.09104
Maximum density ................................. 0.35006
Mean density .................................... 0.00000
Rms deviation from mean density ................. 0.01954
Space-group ..................................... 19
Number of titles ................................ 1
RMS map error
is in the FFT log!
echo labin F1=FOFCWT PHI=PHFOFCWT | fft hklin refine_out.mtz
What is my “resolution” ?
1.
Where do I cut my data?
2.
What do I give to refinement?
3.
What can I claim in my paper?
CC
1/2
→ 0
R
merge
meaningless as I
obs
→ 0
Karplus-Diederichs paired refinement
report “R1”
“Straighten” Wilson Plot for maps?
Retain historical relevance? I/
σ
= 3
Report “3
σ
resolution” for model?
σ
(F) only matters for phasing
How low can you dose?
•
Stay below World Record
•
Look up dose rate
–
http://bl831.als.lbl.gov/damage_rates.pdf
•
Know your limits
–
10 MGy/Å reso, 5 = SeMet, 20 kGy?
•
Can’t outrun damage
•
Long exposures → loose info
•
Resolution: optimum cutoff is 0 Å
•
R-factor is undefined at reso limit
http://bl831.als.lbl.gov/~jamesh/
powerpoint/MRPI_raddam_2017.pptx
Explore the impact of radiation damage on crystallography, focusing on dose proportional to photons per area rather than time or heat. Learn about MGy, radiation damage world records, crystal lifetime based on flux and dose, and self-calibrated damage limits. Discover insights from various studies and research programs.

Download Presentation

Please find below an Image/Link to download the presentation.
The content on the website is provided AS IS for your information and personal use only. It may not be sold, licensed, or shared on other websites without obtaining consent from the author.If you encounter any issues during the download, it is possible that the publisher has removed the file from their server.
You are allowed to download the files provided on this website for personal or commercial use, subject to the condition that they are used lawfully. All files are the property of their respective owners.
The content on the website is provided AS IS for your information and personal use only. It may not be sold, licensed, or shared on other websites without obtaining consent from the author.
E N D
Presentation Transcript
Maximum Data Quality Workshop RADIATION DAMAGE! What you need to know Made possible by: UC Office of the President, Multicampus Research Programs and Initiatives (MRPI) grant MR 15 328599
Damage is done by dose (MGy) proportional to photons/area not time not heat Sliz P, Harrison SC & Rosenbaum G (2003). Structure11, 13-19. Garman EF & McSweeney SM (2006). J. Sync. Rad. 14, 1-3. Owen RL, Rudino-Pinera E & Garman EF (2006). PNAS 103, 4912-4917. Leiros et al. (2006). Acta Cryst. D62, 125-132. Holton JM (2007). J. Synch Rad.14, 51-72.
Radiation Damage World Records MGy reaction reference ~45 10/ 5 4 4 3 1 ~1? 0.5 0.06 0.02 global damage global damage Se-Met Hg-S R-C-COOH S-S Br-RNA Cl-C Mn in PS II putidaredoxin Fe in myoglobin Owen et al. (2006) Howells et al. (2009) Holton (2007) Ramagopal et al.(2004) Garman et al. (2015) Murray et al. (2002) Olieric et al. (2007) ??? Yano et al. (2005) Corbett et al. (2007) Denisov et al. (2007) Holton (2009) J. Synchrotron Rad.16 133-42
what the is a MGy? http://bl831.als.lbl.gov/ damage_rates.pdf Holton J. M. (2009) J. Synchrotron Rad.16 133-42
How long will my crystal last? synch line type flux beamsize flux density dose max xtal min site ph/s m ph/ m2/s rate lifetime lifetime ALS 4.2.2 MAD 1e12 75x80 1.7e+08 124 kGy/s 4 m 16 s ALS 5.0.1 mono 2e11 100 2.5e+07 13 kGy/s 39 m 2.6 m ALS 5.0.2 MAD 1.5e12 100 1.5e+08 76.3 kGy/s 6.6 m 26 s ALS 5.0.3 mono 3e11 100 3.8e+07 19.4 kGy/s 26 m 1.7 m ALS 8.2.1 MAD 3.5e11 100 4.5e+07 22.7 kGy/s 22 m 88 s ALS 8.2.2 MAD 3.5e11 100 4.5e+07 22.7 kGy/s 22 m 88 s ALS 8.3.1 MAD 9e11 70 2.3e+08 119 kGy/s 4.2 m 17 s ALS 12.3.1 MAD 2e11 65x90 3.4e+07 17.4 kGy/s 29 m 1.9 m ALS 12.3.1 ML 4.0e13 65x90 6.8e+09 6.89 MGy/s 4.4 s 0.29 s SSRL 1-5 MAD 1.7e10 200 4.2e+05 202 Gy/s 41 h 2.8 h SSRL 7-1 mono 2.6e11 200 6.5e+06 3.09 kGy/s 2.7 h 11 m SSRL 9-1 mono 3.9e10 200 9.8e+05 463 Gy/s 18 h 72 m SSRL 9-2 MAD 4.8e11 200 1.2e+07 5.7 kGy/s 88 m 5.8 m SSRL 11-1 MAD 3.9e11 200 9.8e+06 4.63 kGy/s 1.8 h 7.2 m SSRL 11-3 mono 2.6e10 200 6.5e+05 302 Gy/s 28 h 1.8 h SSRL 12-2 MAD 4e12 90x5 8.9e+09 5.01 MGy/s 6 s 0.4 s SSRL 12-1 MAD 4e12 5x5 1.6e+11 90 MGy/s 0.35 s 22 ms SSRL 12-1 ML 3e14 5x5 1.1e+13 6.4 GGy/s 5 ms 300 us APS 24-ID-C MAD 1.3e13 20x60 1.1e+10 5.23 MGy/s 5.7 s 0.38 s APS "typical" MAD 1.5e12 80 2.3e+08 119 kGy/s 4.2 m 17 s synch line type flux beamsize flux density dose max xtal min site ph/s m ph/ m2/s rate lifetime lifetime
Self-calibrated damage limit 2 ( ) f 2 4 4 2 f sphere T ( 2 ) ,R R , ,R 9 + 5 10 2 5 . 0 3 cos 4 sin r H a decayed = exp 2 e I B ( 1 ) ( ) 2 ( ) 2 ln sin 0 sin DL hc T , M f n M V r sphere en a NH ASU M Where: I DL 105 re h c fdecayed R fNH nASU Mr VM H a2 Ma B en - average damage-limited intensity (photons/hkl) at a given resolution - converting R from m to m, re from m to , from g/cm3 to kg/m3 and MGy to Gy - classical electron radius (2.818 x 10⁻¹⁵ m/electron) - Planck s constant (6.626 x 10⁻³⁴J s) - speed of light (299792458 m/s) - fractional progress toward completely faded spots at end of data set - density of crystal (~1.2 g/cm3) - radius of the spherical crystal ( m) - X-ray wavelength ( ) - the Nave & Hill (2005) dose capture fraction (1 for large crystals) - number of proteins in the asymmetric unit - molecular weight of the protein (Daltons or g/mol) - Matthews s coefficient (~2.4 3/Dalton) - Howells s criterion (10 MGy/ ) - Bragg angle - number-averaged squared structure factor per protein atom (electron2) - number-averaged atomic weight of a protein atom (~7.1 Daltons) - average (Wilson) temperature factor ( 2) - attenuation coefficient of sphere material (m-1) - mass energy-absorption coefficient of sphere material (m-1) No flux No symmetry Holton & Frankel (2010) Acta D66 393-408.
Bigger is better, but not by much 1 2 3 4 5 6 7 8 9 Resolution ( ) 10 0.1 1 10 100 1000 10000 Crystal diameter (micron)
B factor from image analysis B = 500
B factor from image analysis B = 20
Can radiation damage be outrun ?
Dose-rate effect at Room Temp? Owen RL, Axford D, Nettleship JE, Owens RJ, Robinson JI, Morgan AW, Dore AS, Lebon G, Tate CG, Fry EE, Ren J, Stuart DI & Evans G (2012)."Outrunning free radicals in room-temperature macromolecular crystallography", Acta Cryst. D68, 810-818. Warkentin M, Badeau R, Hopkins JB, Mulichak AM, Keefe LJ & Thorne RE (2012)."Global radiation damage at 300 and 260 K with dose rates approaching 1 MGy s-1", Acta Cryst. D68, 124-133.
Dose-rate dependence of damage 1000 maximum useful dose (MGy) 100 10 Blake & Phillips (1962) room temperature Cheresov (lipid) Barker (native) Barker (additives) cryo-cooled Chapman (2011) Warkentin 2012 Owen (2012) Laue (Schmidt 2013) Popov (unpublished) 1 0.1 0.01 0.0001 0.1 100 100000 1E+08 1E+11 1E+14 1E+17 1E+20 dose rate (kGy/s)
Pilatus pile-up for RT MX? same photons, different speeds SLOW Sum of 193 shots with 193-fold attenuation
Pilatus pile-up for RT MX? same photons, different speeds FAST 1 shot with no attenuation
Pilatus pile-up for RT MX? same photons, different speeds
Pilatus pile-up for RT MX? same photons, different speeds 0.016 mosaic
Do we expect this with protein? Mosaic spread ( ) < 0.02 20 /s rotation 50x50x50 m lysozyme crystal Istill = 0.07*(F/mosaic)2 F=130 3e6 photons/s/spot Max Eiger count rate = 3e6 photons/s/spot 35% of Fs > 130 (lysozyme @ 2.0 ) 45% under-counting expected
What is a streak camera? 0.1 mm/pixel 25 mm/s = 4 ms/pixel
Individual spots at 768 kGy/s 250000 200000 Intensity (photons) 150000 100000 50000 0 -100 0 400 900 1400 Dose (kGy) Same xtal, different spots
Double-tap: no dark progression at 675 kGy/s 330000 280000 Intensity (photons) 230000 180000 130000 80000 30000 0 0.5 1 1.5 2 Dose (kGy)
How much H2 are we making? Meents et al. (2010) claimed: "400 molecules of H2 for every 12.5 keV photon = 3.3x10⁻⁷ mol/J 200 kGy to 100 um3 = 0.24 J = 1.2x10⁻⁸ mol H2 100 um3 of water = 6.7x10⁻⁸ mol 18% of water has reacted!
The number of photons scattered before crystal is dead is independent of flux & time 1 um3 = 105 photons (roomT) 1 um3 = 106 photons (synch) 1 um3 = 108 photons (XFEL) (synch) Henderson, 1990; Gonzalez & Nave, 1994; Glaeser et al., 2000; Sliz et al., 2003; Leiros et al., 2006; Owen et al., 2006; Garman & McSweeney, 2006; Garman & Nave, 2009; Holton, 2009
Dose slicing crystal s useful life N unacceptable completeness photons N photons N unacceptable read noise photons
Adding images % cat << EOF > MERGE2CBF.INP NAME_TEMPLATE_OF_DATA_FRAMES= /data/you/weak_?????.cbf DATA_RANGE= 1 10 NAME_TEMPLATE_OF_OUTPUT_FRAMES=/data/you/sum_???.cbf NUMBER_OF_DATA_FRAMES_COVERED_BY_EACH_OUTPUT_FRAME= 10 EOF % merge2cbf Which is better?: % xds_runme.com /data/you/weak_?????.cbf % xds_runme.com /data/you/sum_?????.cbf
What if? You only have a few small crystals Should you: a) Collect 360 from each? b) Collect 10 from each at 36x exposure? c) Glue 36 xtals together, then collect 360 ? d) Glue, and do 12960 faint exposures?
true resolution limit 1 CCright 0.8 CC vs right answer 0.6 0.4 0.2 0 -0.2 -0.4 2 2.2 2.4 2.6 2.8 3 3.2 3.4 3.6 3.8 4 Resolution ( )
true resolution vs strategy Dose slice collection scenario Glue & fine fine coarse glue 3.17700 3.14057 3.17604 3.12086 301,640,334 photons/xtal
resolution limit coarse 3.14057 3.17604 3.12086 3.16251 3.15922 3.16675 3.12162 3.27289 3.15617 3.38929 3.12162 processing procedure XDS/XSCALE XDS/aimless XDS/noscale fine 3.17700 glue glue&fine MOSFLM-defaults x x x x MOSFLM-cheat 3.19755 3.18166 3.20354 3.19755 HKL2000-defaults x x x x HKL2000-expert 3.21803 3.12646 3.11551 3.21803 HKL2000-cheat DIALS-defaults DIALS-expert d*Trek EVAL15 EVAL15-sadabs 3.16119 3.10338 3.10338 3.16300 x x 3.10296 3.09547 3.07653 3.08465 ? ? 3.14352 3.10383 3.09936 3.14105 3.13920 3.10797 3.10171 3.13700 3.42125 x 4.34076 ?
Optimum exposure time? ~1 photon/pixel XDS, DIALS ~10 photon/pixel HKL2000, MOSFLM ~30 photon/pixel CCD detector adjust exposure so this is ~100
Adding images % cat << EOF > MERGE2CBF.INP NAME_TEMPLATE_OF_DATA_FRAMES= /data/you/weak_?????.cbf DATA_RANGE= 1 10 NAME_TEMPLATE_OF_OUTPUT_FRAMES=/data/you/sum_???.cbf NUMBER_OF_DATA_FRAMES_COVERED_BY_EACH_OUTPUT_FRAME= 10 EOF % merge2cbf Which is better?: % xds_runme.com /data/you/weak_?????.cbf % xds_runme.com /data/you/sum_?????.cbf lossy compression
But my reviewer says Rmerge in high-resolution bin is >100% ! Answer: this is expected
Expected Rmerge as Iobs 0 obs I I = R merge obs I
Averaging Gaussian error 0.5 0.4 average 0.3 Average value 0.2 0.1 0 0.45 -0.1 0.4 histogram 0.35 gaussian 0.3 -0.2 0.25 0.2 0.15 -0.3 0.1 0.05 0 -4 -3 -2 -1 0 1 2 3 4 -0.4 1 10 100 1000 10000 100000 Number of samples averaged
Averaging Gauss/Gauss error 3 average 2 1 Average value 0 -1 -2 0.45 0.4 histogram 0.35 gaussian 0.3 -3 0.25 0.2 0.15 0.1 -4 0.05 0 -0.05 -4 -3 -2 -1 0 1 2 3 4 -5 1 10 100 1000 10000 100000 1000000 Number of samples averaged
Rmerge at the resolution limit in PDB 0.6 Average outer-shell Rmerge 0.5 0.4 0.3 0.2 0.1 0 1993 1995 1998 2001 2004 2006 2009 2012 2014 2017 Year
Take-home lesson: R factors are undefined as Iobs 0 Report as in outer bin
Optimum resolution cutoff is: Too optimistic: add nothing but noise Too pessimistic: series-termination error Happy medium? Simulate: Random atoms, compute F2 Add Gaussian noise, RMS = 1 Truncate Subtract right map, RMS difference
Optimal resolution cutoff 0.02 total error 0.018 series termination 0.016 Error in map (rms e-) noise in data 0.014 0.012 0.01 0.008 0.006 0.004 0.002 0 0.8 0.9 1 1.1 1.2 1.3 Resolution cutoff ( )


 Acta D66 393-408.")