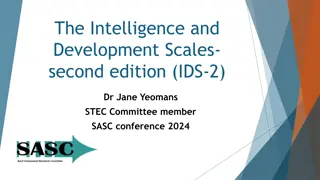
Challenges in Wind Damage Assessment Scales


T
h
e
I
n
t
e
r
n
a
t
i
o
n
a
l
F
u
j
i
t
a
(
I
F
)
S
c
a
l
e
P
i
e
t
e
r
G
r
o
e
n
e
m
e
i
j
e
r
,
A
l
o
i
s
M
.
H
o
l
z
e
r
,
T
o
m
á
š
P
ú
č
i
k
’
,
T
h
i
l
o
K
ü
h
n
e

IF working group:
Pieter Groenemeijer – ESSL
Lothar Bock – DWD, Germany
Juan de Dios Soriano – AEMet , Spain
Maciej Dutkiewicz – Bydgoszcz Univ., Poland
Delia Gutiérrez-Rubio – AEMet, Spain
Alois M. Holzer – ESSL
Martin Hubrig – Germany
Rainer Kaltenberger – Austria
Thilo Kühne – ESSL
Mortimer Müller – Univ. für Bodenkultur, Austria
Bas van der Ploeg – Netherlands
Tomá
š
Pú
č
ik – ESSL
Thomas Schreiner – ESSL
Miroslav Šinger – SHMI, Slovakia
Gabriel Strommer – ESSL
Andi Xhelaj – Univ. of Genova, Italy
Why?
F(x) = 6.30 (x + 2)
1.5
m/s
The goal of a wind damage scale:
•
compare tornado* events by estimating the wind
speed responsible for the damage
Until now, the European Severe Weather Database has
used the
Fujita scale
for rating tornado and wind
damage
The Fujita scale expresses wind speeds with a formula:
Why?
F(x) = 6.30 (x + 2)
1.5
m/s
Two problems:
1.
damage descriptions are too general
2.
wind speed / damage relation not backed
up by science
Why?
Two problems:
1.
damage descriptions are too general
2.
wind speed / damage relation not backed
up by science
Fujita in 1992 suggested to distinguish
damage to weaker from stronger houses
Why?
Two problems:
1.
damage descriptions are too general
2.
wind speed / damage relation not backed
up by science
ESSL developed a similar approach in 2012
Two problems:
1.
damage descriptions are too general
2.
wind speed / damage relation not backed
up by science
The EF-scale (2007) tried to address this
problem as well
Why?
•
Introduced an extensive list of damage indicators
•
Used the expert opinion‘s of engineers and
meteorologists to connect wind speeds to
various degrees of damage
•
New wind speeds imply that the old speeds were
far off
New problems:
•
damage indicators were not applicable to
other places in the world
Why?
Introduced an extensive list of damage indicators
Used the expert opinion‘s of engineers and
meteorologists to connect wind speeds to various
degrees of damage
New wind speeds imply that the old speeds were far
off
Damage indicator: elementary school
New problems:
•
damage indicators were not applicable to
other places in the world
•
more damage indicators were needed
Why?
Development of regional variants of the EF-scale
in Japan, Canada, and France
New problems:
•
damage indicators were not applicable to
other places in the world
•
more damage indicators were needed
•
changed wind speeds?
Why?
Revisions imply massive past estimation errors,
both lower and upper-end of the scale
ESSL does not think low-end events wind speeds
were underestimated, so why would we need to
correct something?
New problems:
•
damage indicators were not applicable to
other places in the world
•
more damage indicators were needed
•
changed wind speeds?
Why?
Revisions imply massive past estimation errors,
both lower and upper-end of the scale
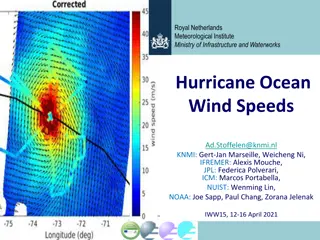
Doppler radar and photogrammetric analyses
show winds well into F5. So were the upper-end
corrections warranted?
New problems:
•
damage indicators were not applicable to
other places in the world
•
more damage indicators were needed
•
changed wind speeds?
Why?
Revisions imply massive past estimation errors,
both lower and upper-end of the scale
Doppler radar and photogrammetric analyses
show winds well into F5. So were the upper-end
corrections warranted?
Still from video by Reed Timmer on Youtube&Twitter
of the 2022 Andover, KS tornado. (EF-3)
118 m/s
Fastest Doppler wind
(Wurman et al, 2021):
144 m/s
The answer is:
We don‘t know, because these scales use a
3-second averaged horizontal wind speed* at 10
m AGL, but
this speed is (almost) never
measured in a tornado
Why?
Revisions imply massive estimation errors were
made in the past
Doppler radar and photogrammetric analyses
show winds well into F5. So were the upper-end
corrections warranted?
118 m/s
Fastest Doppler wind
(Wurman et al, 2021):
144 m/s
The answer is:
We don‘t know, because these scales use a
3-second averaged horizontal wind speed* at 10
m AGL, but
this speed is (almost) never
measured in a tornado
Why?
In the literature we do find:
•
occasional mobile Doppler radar
measurements
•
rarely, photogrammetric analyses from videos
118 m/s
Fastest Doppler wind
(Wurman et al, 2021):
144 m/s
The answer is:
We don‘t know, because these scales use a
3-second averaged horizontal wind speed* at 10
m AGL, but
this speed is (almost) never
measured in a tornado
damage is also produced by shorter-duration
wind speeds
Why?
In the literature we do find:
•
occasional mobile Doppler radar
measurements
•
rarely, photogrammetric analyses from videos
they effectively measure much shorter-duration
wind speeds
In the International Fujita scale:
We use the instantaneous 3-dimensional
wind speed at the height of the damage
The IF-scale
•
Results from a series of workshops since 2014
•
Is developed by a group of contributors from
ESSL, weather services (e.g., AEMet, DWD),
engineering, and forestry.
•
Uses original Fujita scale wind speeds, but only
with rounded central value estimates
•
Uses half steps for the lower part of the scale
The IF-scale
•
Radial wind speeds from radars close to
the ground, photogrammetric analyses
and high frequency anemometer data can
now be used to estimate a lower bounds
for the maximum intensity.
Red dots:
Mobile Doppler radar-derived
maximum wind speeds in
tornadoes by Wurman et al.
2021.
The IF-scale
•
Radial wind speeds from radars close to the
ground, photogrammetric analyses and high
frequency anemometer data can now be used to
estimate the lower bounds for the maximum
intensity.
•
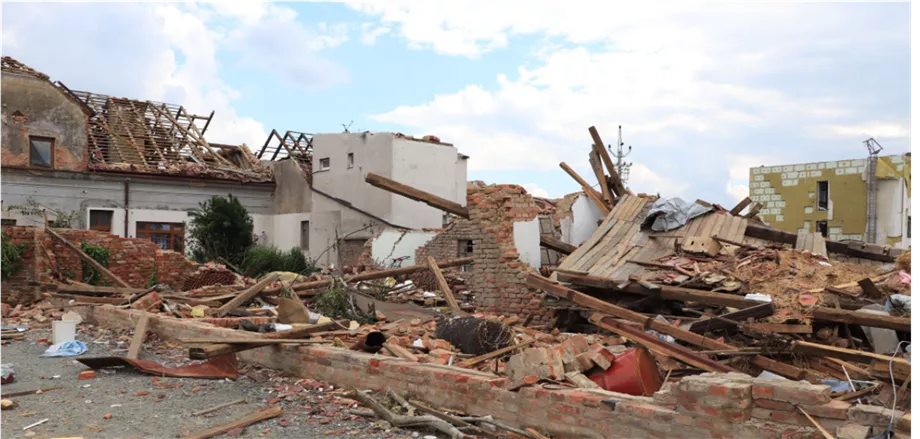
Was tested in the South Moravia tornado case,
which led to a number of improvements
The IF-scale
•
Includes more generic Damage Indicators, such
as the DI „Building“ to help usage in regions with
different building practices, making it more
international
The IF-scale
•
Includes more generic Damage Indicators, such
as the DI „Building“ to help usage in regions with
different building practices, making it more
international
•
List of DI‘s contains many borrowed damage
indicators from the J/C/EF-scale with (slightly)
upward adjusted wind speeds
•
Can be expanded further
List of Damage Indicators (DI’s)
The IF-scale app
•
will soon be shared with ESSL observers
for testing
•
gives the IF rating that belongs to the
Damage Indicator and Degree of Damage.
•
allows photos and commenting and gives
a map overview
The IF-scale
The IF scale is now open for review by ESSL
partners and the wider community
until 31 May
.
•
The document can be found on the ESSL website
https://
www.essl.org
(under Research)
•
Version 1.0 finalized and implemented in the
ESWD as soon as possible (summer 2023) after
taking last feedback into account.
•
ESWD will keep all old F / T-scale ratings
•
Some old cases may be rated again with the new
IF scale
The European Severe Storms Laboratory and the International Fujita Scale have been pivotal in evaluating wind damage from tornado events. However, issues such as vague damage descriptions, lack of scientific backing for wind-damage relationships, and applicability to different regions have posed challenges. Efforts have been made by experts to refine these assessments, introduce new damage indicators, and improve the connection between wind speeds and damage severity.

Download Presentation

Please find below an Image/Link to download the presentation.
The content on the website is provided AS IS for your information and personal use only. It may not be sold, licensed, or shared on other websites without obtaining consent from the author.If you encounter any issues during the download, it is possible that the publisher has removed the file from their server.
You are allowed to download the files provided on this website for personal or commercial use, subject to the condition that they are used lawfully. All files are the property of their respective owners.
The content on the website is provided AS IS for your information and personal use only. It may not be sold, licensed, or shared on other websites without obtaining consent from the author.
E N D
Presentation Transcript
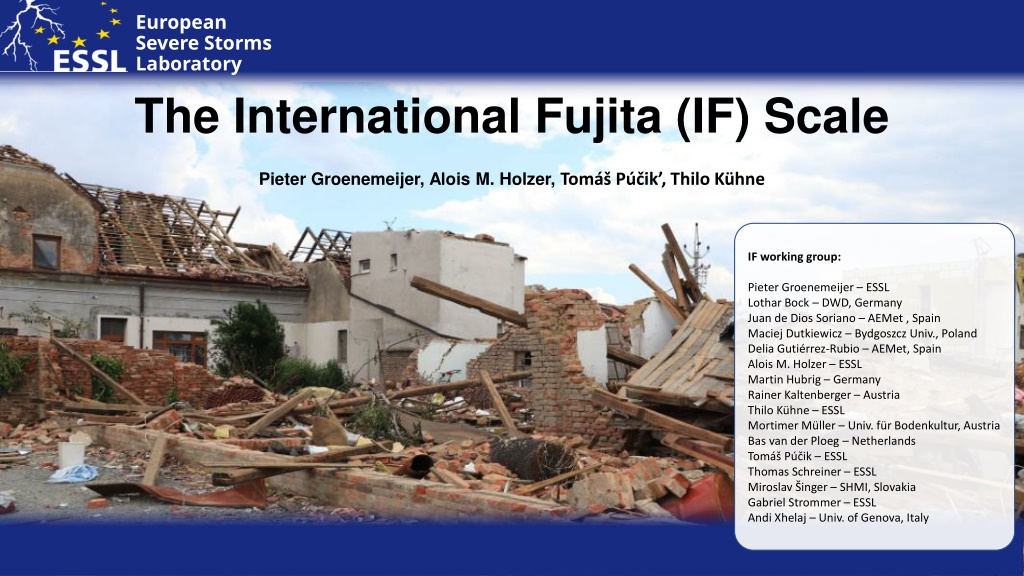
European Severe Storms Laboratory The International Fujita (IF) Scale Pieter Groenemeijer, Alois M. Holzer, Tom P ik , Thilo K hne IF working group: Pieter Groenemeijer ESSL Lothar Bock DWD, Germany Juan de Dios Soriano AEMet , Spain Maciej Dutkiewicz Bydgoszcz Univ., Poland Delia Guti rrez-Rubio AEMet, Spain Alois M. Holzer ESSL Martin Hubrig Germany Rainer Kaltenberger Austria Thilo K hne ESSL Mortimer M ller Univ. f r Bodenkultur, Austria Bas van der Ploeg Netherlands Tom P ik ESSL Thomas Schreiner ESSL Miroslav inger SHMI, Slovakia Gabriel Strommer ESSL Andi Xhelaj Univ. of Genova, Italy
Why? The goal of a wind damage scale: compare tornado* events by estimating the wind speed responsible for the damage Until now, the European Severe Weather Database has used the Fujita scale for rating tornado and wind damage F(x) = 6.30 (x + 2)1.5m/s The Fujita scale expresses wind speeds with a formula:
Why? Two problems: 1. damage descriptions are too general 2. wind speed / damage relation not backed up by science F(x) = 6.30 (x + 2)1.5m/s
Why? Two problems: 1. damage descriptions are too general 2. wind speed / damage relation not backed up by science Fujita in 1992 suggested to distinguish damage to weaker from stronger houses
Why? Two problems: 1. damage descriptions are too general 2. wind speed / damage relation not backed up by science ESSL developed a similar approach in 2012
Why? Two problems: Introduced an extensive list of damage indicators 1. damage descriptions are too general Used the expert opinion s of engineers and meteorologists to connect wind speeds to various degrees of damage 2. wind speed / damage relation not backed up by science The EF-scale (2007) tried to address this problem as well New wind speeds imply that the old speeds were far off
Why? New problems: damage indicators were not applicable to other places in the world Introduced an extensive list of damage indicators Used the expert opinion s of engineers and meteorologists to connect wind speeds to various degrees of damage New wind speeds imply that the old speeds were far off
Why? New problems: damage indicators were not applicable to other places in the world Introduced an extensive list of damage indicators Damage indicator: elementary school Used the expert opinion s of engineers and meteorologists to connect wind speeds to various degrees of damage New wind speeds imply that the old speeds were far off
Why? New problems: damage indicators were not applicable to other places in the world Introduced an extensive list of damage indicators Damage indicator: elementary school Used the expert opinion s of engineers and meteorologists to connect wind speeds to various degrees of damage New wind speeds imply that the old speeds were far off
Why? New problems: damage indicators were not applicable to other places in the world Introduced an extensive list of damage indicators Damage indicator: elementary school Used the expert opinion s of engineers and meteorologists to connect wind speeds to various degrees of damage New wind speeds imply that the old speeds were far off
Why? New problems: damage indicators were not applicable to other places in the world Introduced an extensive list of damage indicators Damage indicator: elementary school Used the expert opinion s of engineers and meteorologists to connect wind speeds to various degrees of damage New wind speeds imply that the old speeds were far off
Why? New problems: damage indicators were not applicable to other places in the world more damage indicators were needed Development of regional variants of the EF-scale in Japan, Canada, and France
Why? Revisions imply massive past estimation errors, both lower and upper-end of the scale New problems: damage indicators were not applicable to other places in the world ESSL does not think low-end events wind speeds were underestimated, so why would we need to correct something? more damage indicators were needed changed wind speeds?
Why? Revisions imply massive past estimation errors, both lower and upper-end of the scale New problems: damage indicators were not applicable to other places in the world Doppler radar and photogrammetric analyses show winds well into F5. So were the upper-end corrections warranted? more damage indicators were needed changed wind speeds?
Why? Revisions imply massive past estimation errors, both lower and upper-end of the scale New problems: damage indicators were not applicable to other places in the world Doppler radar and photogrammetric analyses show winds well into F5. So were the upper-end corrections warranted? more damage indicators were needed Fastest Doppler wind (Wurman et al, 2021): changed wind speeds? 118 m/s 144 m/s Still from video by Reed Timmer on Youtube&Twitter of the 2022 Andover, KS tornado. (EF-3)
Why? Revisions imply massive estimation errors were made in the past The answer is: We don t know, because these scales use a 3-second averaged horizontal wind speed* at 10 m AGL, but this speed is (almost) never measured in a tornado Doppler radar and photogrammetric analyses show winds well into F5. So were the upper-end corrections warranted? Fastest Doppler wind (Wurman et al, 2021): 118 m/s 144 m/s
Why? In the literature we do find: occasional mobile Doppler radar measurements rarely, photogrammetric analyses from videos The answer is: We don t know, because these scales use a 3-second averaged horizontal wind speed* at 10 m AGL, but this speed is (almost) never measured in a tornado Fastest Doppler wind (Wurman et al, 2021): 118 m/s 144 m/s
Why? In the literature we do find: occasional mobile Doppler radar measurements rarely, photogrammetric analyses from videos The answer is: We don t know, because these scales use a 3-second averaged horizontal wind speed* at 10 m AGL, but this speed is (almost) never measured in a tornado they effectively measure much shorter-duration wind speeds damage is also produced by shorter-duration wind speeds In the International Fujita scale: We use the instantaneous 3-dimensional wind speed at the height of the damage
The IF-scale Results from a series of workshops since 2014 Is developed by a group of contributors from ESSL, weather services (e.g., AEMet, DWD), engineering, and forestry. Uses original Fujita scale wind speeds, but only with rounded central value estimates Uses half steps for the lower part of the scale
The IF-scale Radial wind speeds from radars close to the ground, photogrammetric analyses and high frequency anemometer data can now be used to estimate a lower bounds for the maximum intensity. Red dots: Mobile Doppler radar-derived maximum wind speeds in tornadoes by Wurman et al. 2021.
The IF-scale Radial wind speeds from radars close to the ground, photogrammetric analyses and high frequency anemometer data can now be used to estimate the lower bounds for the maximum intensity. Was tested in the South Moravia tornado case, which led to a number of improvements
The IF-scale Includes more generic Damage Indicators, such as the DI Building to help usage in regions with different building practices, making it more international
List of Damage Indicators (DIs) The IF-scale Includes more generic Damage Indicators, such as the DI Building to help usage in regions with different building practices, making it more international List of DI s contains many borrowed damage indicators from the J/C/EF-scale with (slightly) upward adjusted wind speeds Can be expanded further
The IF-scale app will soon be shared with ESSL observers for testing gives the IF rating that belongs to the Damage Indicator and Degree of Damage. allows photos and commenting and gives a map overview
The IF-scale The IF scale is now open for review by ESSL partners and the wider community until 31 May. The document can be found on the ESSL website https://www.essl.org (under Research) Version 1.0 finalized and implemented in the ESWD as soon as possible (summer 2023) after taking last feedback into account. ESWD will keep all old F / T-scale ratings Some old cases may be rated again with the new IF scale


")