Provisional GDP Estimates for Third Quarter 2018 Presentation
The provisional GDP estimates for the third quarter of 2018 were released by Mr. Baah Wadieh, the Government Statistician. The GDP measures the value of final goods and services produced in the country, with sector-wise distribution figures highlighted. The estimate includes both oil and non-oil components, showing significant figures for various sectors. The estimation process is explained and further revisions are scheduled for April 2019.
Download Presentation

Please find below an Image/Link to download the presentation.
The content on the website is provided AS IS for your information and personal use only. It may not be sold, licensed, or shared on other websites without obtaining consent from the author.If you encounter any issues during the download, it is possible that the publisher has removed the file from their server.
You are allowed to download the files provided on this website for personal or commercial use, subject to the condition that they are used lawfully. All files are the property of their respective owners.
The content on the website is provided AS IS for your information and personal use only. It may not be sold, licensed, or shared on other websites without obtaining consent from the author.
E N D
Presentation Transcript
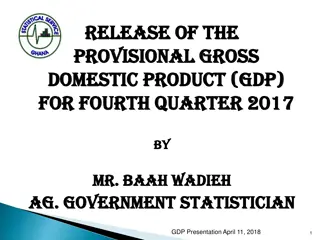
Release of the Release of the provisional GROSS provisional GROSS DOMESTIC PRODUCT (GDP) DOMESTIC PRODUCT (GDP) for THIRD quarter 2018 for THIRD quarter 2018 by by Mr. Mr. baah baah wadieh Ag. GOVERNMENT Ag. GOVERNMENT statistician wadieh statistician GDP Presentation October 17, 2018 1
Provisional GDP estimates for the third quarter of 2018 Highlights GDP Presentation October 17, 2018 2
The Gross Domestic Product (GDP) measures the value of final goods and services produced in the country. One key indicator (Quarterly GDP) is presented in this release: Quarterly GDP measures the value of final goods and services within a period of three months or one quarter. GDP Presentation October 17, 2018 3
The estimation of the GDP is done in stages, with the estimates generated at each stage being dependent on available data. Estimates from each stage are progressively designated as provisional, revised and final. This release contains the provisional GDP estimates for the third quarter of 2018 based on the new series with base year 2013. Further revisions to the 2013 Q1 to 2018 Q3 GDP estimates will be carried out in April 2019. GDP Presentation October 17, 2018 4
The provisional 2018 Q3 GDP estimate (incl. oil) at current prices at purchaser s value1 is GH was GH 63 GH 75 75, ,008 008. .4 4 million. The estimate for 2017 Q3 63, ,447 447. .4 4 million. The provisional 2018 Q3 GDP estimate (excl. oil) at current prices at purchaser s value1 is GH was GH 60 GH 72 72, ,546 546. .6 6 million. The value for 2017 Q3 60, ,985 985. .6 6 million. 1 1Includes Includes Net Net Indirect Indirect Taxes Taxes GDP Presentation October 17, 2018 6
Sector Sector GDP Estimate 13,199.9 GDP Estimate Percentage Distribution Percentage Distribution Agriculture 19.2% 24,318.0 35.3% Industry Services 31,336.3 45.5% GDP at basic prices 68,854.2 100.0% GDP at purchaser s value (including net indirect taxes) 75,008.4 GDP Presentation October 17, 2018 7
The constant GDP estimate (incl. oil) for Q3 of 2018 is GH for Q3 of 2017 was GH 36,605.6 million. GH 39,299.4 39,299.4 million while the estimate The constant GDP estimate (excl. oil) for Q3 of 2018 is GH for Q3 of 2017 was GH 33,438.6 million. GH 36,272.7 36,272.7 million. The value recorded GDP Presentation October 17, 2018 8
The provisional 2018 Q3 year-on-year Real GDP (incl. Oil1) growth rate is 7.4% compared to 8.7% recorded for 2017 Q3. The non-Oil provisional 2018 Q3 year-on- year Real GDP growth rate is 8.5% compared to 4.9% recorded for 2017 Q3. Quarter-on-quarter seasonally adjusted 2018 Q3 GDP grew by 1.8%, compared to 1.3% growth rate recorded for 2018 Q2. Note Note: incl. Oil : incl. Oil1 1 means Oil and Gas means Oil and Gas GDP Presentation October 17, 2018 9
The quarter-on-quarter seasonally adjusted GDP growth rate for the 3rd quarter of 2018 was 1.8%. This means that the value of goods and services produced in the 3rd quarter of 2018 grew by 1.8% over the value recorded in the 2nd quarter of 2018. Seasonally Adjusted Seasonally Adjusted at Constant 2013 (GH at Constant 2013 PricesGDP (GH million) PricesGDP million) Quarter Quarter GDP Estimate 38,006.3 37,332.9 36,849.0 36,359.5 Growth Rate 1.8 1.3 1.3 1.4 2018Q3 2018Q2 2018Q1 2017Q4 10 GDP Presentation October 17, 2018
The year-on-year quarterly GDP growth rate for Agriculture is 5.5 % for the third quarter of 2018. The crops sub-sector recorded the highest year-on-year growth rate of 6.8 % while the Fishing sub-sector recorded the lowest growth rate of -0.8 %. GDP Q3 2017 (GH million) Crops o/w Cocoa Livestock 1,064.8 Forestry & logging Fishing 571.8 Total 6,835.5 GDP GDP GDP Q3 2017 Q3 2018 (GH million) 4999.7 Q3 2018 Y/Y Change Rate (%) Y/Y Change Rate (%) Agriculture Sub- -sector Agriculture Sub sector 6.8 3.7 4,682.9 387.8 402.2 1,125.4 517.4 5.7 0.3 -0.8 5.5 516.0 567.4 Total 5.5 7,209.8 7,209.8 GDP Presentation October 17, 2018 11
The year-on-year quarterly GDP growth rate for the Industry sector is 11.7% for Q3 of 2018. The Mining & Quarrying sub-sector recorded the highest year-on- year quarterly GDP growth rate of 23.9% for Q3 of 2018, while the Water & sewerage sub-sector recorded the lowest -4.9%. GDP Q3 2017 (GH million) Mining and Quarrying o/w Oil and Gas Manufacturing Electricity Water & Sewerage Construction Total GDP GDP GDP Q3 2017 Q3 2018 (GH million) 6,829.1 3,026.7 4,736.6 465.0 185.2 3,587.4 15,803.2 Q3 2018 Y/Y Change Rate (%) Y/Y Change Rate (%) Industry Sub Industry Sub- -sector sector 5,512.0 3,167.0 4,448.3 440.2 194.6 3,557.0 23.9 -4.4 6.5 5.6 -4.9 0.9 11.7 15,803.2 11.7 Total 14,152.1 14,152.1 GDP Presentation October 17, 2018 12
For the third quarter of 2018, the Services sector recorded a year-on-year quarterly GDP growth rate of 3.5%. The Health & Social Work sub-sector recorded the highest year-on-year quarterly GDP growth rate of 28.4% while the Real Estate sub-sector recorded the lowest growth rate of -16.7%. GDP GDP GDP GDP Y/Y Change Rate (%) Y/Y Change Rate (%) Q3 2017 Q3 2017 Q3 2018 Q3 2018 Services Sub- -sector Services Sub Trade, Repair of Vehicles, Household Goods Hotels and Restaurants Transport & Storage Information & Communication Financial & Insurance Activities Real Estate Professional, Admin.& Support Services Public Administration, Defense & Soc. Education Health & Social Work Other Personal Service Activities Total sector 3,570.9 1,326.5 1,856.6 771.6 1,625.3 379.3 434.0 1191.7 1,326.4 727.4 413.1 13,622.6 3,675.2 1,398.3 1,936.5 847.7 1,482.2 316.1 465.3 1,215.9 1,402.4 933.8 422.1 14,095.4 2.9 5.4 4.3 9.9 -8.8 -16.7 7.2 2.0 5.7 28.4 2.2 3.5 13,622.6 3.5 Total 14,095.4 13 GDP Presentation October 17, 2018
The Q3 2018 GDP at current prices was estimated at GH 75,008.4 million. The corresponding value recorded for Q3 2017 was GH 63,477.7 million. In constant terms, the Q3 2018 GDP was estimated at GH 39,299.4 million. For Q3 2017, the estimated value was GH 36,605.6 million. The year-on-year quarterly GDP growth rate for Q3 2018 was 7.4% compared to the 8.7% recorded for Q3 2017. The quarter-on-quarter GDP growth rate (seasonally adjusted) for Q3 2018 was 1.8%, compared to the growth rate (1.3%) recorded for the second quarter of 2018. GDP Presentation October 17, 2018 14
