Providence Hills Survey Responses
Detailed analysis of survey responses from Providence Hills residents, focusing on ownership trends, key findings, and priority areas for improvement and events planning. The report includes demographic insights, feature preferences, and recommendations for community enhancement.
Uploaded on Mar 01, 2025 | 0 Views
Download Presentation

Please find below an Image/Link to download the presentation.
The content on the website is provided AS IS for your information and personal use only. It may not be sold, licensed, or shared on other websites without obtaining consent from the author.If you encounter any issues during the download, it is possible that the publisher has removed the file from their server.
You are allowed to download the files provided on this website for personal or commercial use, subject to the condition that they are used lawfully. All files are the property of their respective owners.
The content on the website is provided AS IS for your information and personal use only. It may not be sold, licensed, or shared on other websites without obtaining consent from the author.
E N D
Presentation Transcript
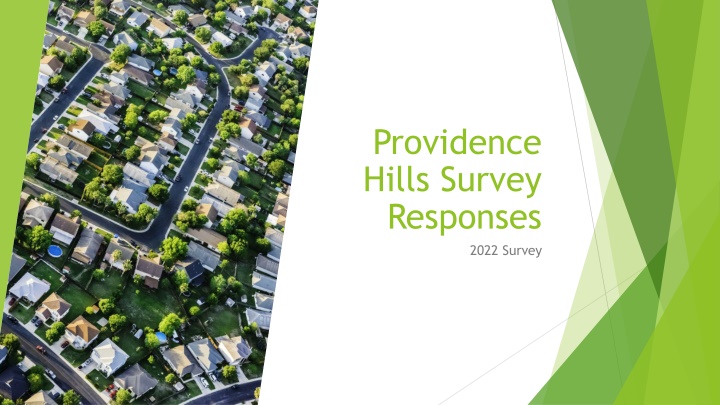
Providence Hills Survey Responses 2022 Survey
Purpose Collect input from residents to inform programming and planning Review results, with expectation of list of recommendations for Board
Who Took Survey? Valid Sample Size? 16 14 41 homes (15.8%) v. 15% target 12 10 Average Years of Ownership: 12.2 (y) v. 13.3 (avg) Response 8 No Response 6 Median Years of Ownership: 10 (y) v. 13 (avg) 4 2 0 0 1 2 3 4 5 6 7 8 9 10 11 12 13 14 15 16 17 18 19 20 21 22 23 24 25 26 27 28
Assessing the Results Emily, Lower 40s, Two Kids (3rdgrade, preschool), Been in Neighborhood 4 Years Keith, Mid 60s, No Kids at Home, Been in Neighborhood 22 Years Personas Overall Children v. No Children/At Home Below v. Above Median Ownership Age Categorization
Top Priority Areas Grouping Top #2 #3 #4 #5 Overall Common Area Improvements Common Area Maintenance Homeowner Upkeep Neighborhood Safety Traffic Children at Home Common Area Improvements Family Social Activities (Tie 2) Neighborhood Safety (Tie - 2) Homeowner Upkeep (Tie 4) Neighborhood Communications (Tie 4) No Children at Home Homeowner Upkeep Traffic Rental Properties Common Area Maintenance (Tie 4) Family Social Activites (Tie 4) Common Area Maintenance Common Area Improvements (Tie 4) Homeowner Upkeep (Tie 4) Ownership < Median Common Area Improvements Neighborhood Safety (Tie 2) Homeowner Upkeep (Tie 1) Common Area Maintenance (Tie 2) Traffic (Tie 1) Ownership > Median Common Area Improvements (Tie 1) Covenants Violations
Grouping Easter Petting Zoo/Egg Hunt 34% Neighborhood Yard Sale Pool Opening Party Monthly Happy Hours Pool Closing Party Halloween Parade Holiday Party / Luminaries Overall 30% 66% 61% 52% 45% 80% Children at Home 55% 32% 73% 64% 55% 59% 86% No Children at Home 16% 32% 68% 68% 58% 37% 84% Ownership < Median 45% 36% 59% 73% 50% 59% 91% Ownership > Median 24% 24% 76% 52% 57% 33% 71% Community Event Attendance
Age Range % of Extrapolated # of Households 107 Respondents No Children / No Children Living At Home 41% Children In The Future / Under 1 7% 17 Toddler (1-5 years) 20% 51 Kids (5-13 years) 17% 45 Teenager (13-18 years) 15% 39 Children Age Ranges
4thof July: Parade, Fireworks Participation Organized Pickleball Group/League Block Party Book Club Panthers Watch Party Clubs Thanksgiving: 5k / Toddle Trot, Something Community Golf Outing Event Ideas Trivia Night Family/Children: BBQ/Picnic/Meet & Greet (During Kids Hours), Get- Togethers/Play Groups for Kids Movie Night Organized Halloween
Grouping Never Sparingly Monthly Weekly Daily Overall 15% 15% 17% 51% 2% Children at Home 9% 9% 9% 68% 5% No Children at Home 21% 21% 26% 32% 0% Ownership < Median 5% 9% 23% 59% 5% Ownership > Median 24% 19% 10% 38% 0% Use of Pool
Grouping Never Sparingly Monthly Weekly Daily Overall 44% 37% 17% 2% 0% Children at Home 41% 32% 27% 0% 0% No Children at Home 47% 42% 5% 5% 0% Ownership < Median 41% 36% 23% 0% 0% Ownership > Median 47% 37% 11% 5% 0% Use of Tennis/Pickleball
Grouping Never Sparingly Monthly Weekly Daily Overall 32% 34% 24% 10% 0% Children at Home 14% 41% 32% 14% 0% No Children at Home 53% 37% 5% 5% 0% Ownership < Median 18% 23% 45% 14% 0% Ownership > Median 47% 47% 5% 0% 0% Use of Playground
Grouping Never Seldom Sometimes Often Overall 41% 37% 20% 2% Children at Home 55% 23% 18% 5% No Children at Home 26% 53% 21% 0% Ownership < Median 48% 33% 14% 5% Ownership > Median 35% 40% 25% 0% Use of Clubhouse
Use of Amenities Comparison Grouping Never Sparingly Monthly Weekly Daily N/A Clubhouse 41% 37% (Seldom) 34% 20% 2% (Sometimes) 24% (Often) 10% Playground 32% 0% Pool 15% 15% 17% 51% 2% Tennis/Pickleball 44% 37% 17% 2% 0%
Access: to Pool Deck Until 2AM Amenities: Games/Movie Selection Interior Upkeep: New Tables, Chairs, Paint, D cor; Carpet Documentation/Communi cation: Knowledge to Reservation Process & Facility Information Technology: Functional TV, Wi-Fi, Updated Sound System Clubhouse Change Ideas Exterior Upkeep: Gutters Clogged, Spiders and Wasps, Windows, Paint Facility Layout: Larger Kitchen, Updated Kitchen, Outdoor Seating, Grill Hours: Ability to Reserve
Grouping Average Median Net Promoter Score Overall 4.1 4.0 -59 Children at Home 3.9 3.0 -67 No Children at Home 4.2 4.0 -47 Ownership < Median 4.1 3.5 -65 Ownership > Median 4.1 3.5 -50 Open Clubhouse
Volunteer Opportunities Opportunity Interested Involvement 2 Architectural Review Committee Building & Grounds 3 Communications 1 Events Committee 0 HOA Board 0 Neighborhood Watch 1 Outreach 2
Other Input Appearance is speeding issue not prioritized high enough Better landscaping at Hampton Glen neighborhood entrance 5 and 10 Year Capital Improvement Plan Access to annual budget/expenditures report More information about renting clubhouse process Review and/or knowledge sharing of Covenants More opportunities to get kids together Dues for limited use Value in pool committee
