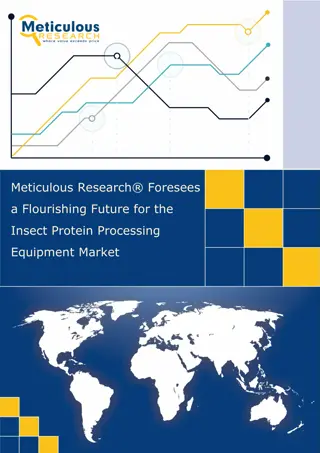
Protein Structures Program and Data Processing

V
9
–
P
r
o
t
e
i
n
s
t
r
u
c
t
u
r
e
s
Program for today:
-
Structures from protein X-ray crystallography
-
Statistics of protein structures
-
Statistical potentials
1
V9
Processing of Biological Data
P
D
B
f
i
l
e
s
2
V9
Processing of Biological Data
www.rcsb.org
ATOM 1 N
VAL E 15 -6.512 -12.177 -13.595 1.00 64.39
ATOM 2 CA
VAL E 15 -5.276 -11.431 -13.476 1.00 47.83
ATOM 3 C
VAL E 15 -4.815 -10.815 -14.785 1.00 35.56
ATOM 4 O
VAL E 15 -4.806 -9.592 -14.904 1.00 99.02
ATOM 5 CB
VAL E 15 -4.193 -12.092 -12.629 1.00 100.00
ATOM 6 CG1
VAL E 15 -2.823 -11.529 -12.987 1.00 50.97
ATOM 7 CG2
VAL E 15 -4.494 -11.830 -11.149 1.00 35.72
ATOM 8 N
LYS E 16 -4.475 -11.641 -15.778 1.00 35.94
ATOM 9 CA
LYS E 16 -4.060 -11.108 -17.074 1.00 55.13
ATOM 10 C
LYS E 16 -5.100 -10.105 -17.531 1.00 59.23
ATOM 11 O
LYS E 16 -4.877 -9.036 -18.103 1.00 35.80
ATOM 12 CB
LYS E 16 -3.916 -12.209 -18.110 1.00 47.57
ATOM 13 CG
LYS E 16 -2.850 -11.886 -19.158 1.00 100.00
ATOM 14 CD
LYS E 16 -1.491 -12.525 -18.888 1.00 94.01
ATOM 15 CE
LYS E 16 -0.665 -11.794 -17.836 1.00 100.00
ATOM 16 NZ
LYS E 16 -0.505 -12.557 -16.586 1.00 89.11
Atom-number
Atom type
Residue type
Chain ID
Residue number
X-coordinae
Y-coordinate
Z-coordinate
Occupancy
B-factor
X-ray structure 1atp of
the cAMP-dependent
protein kinase
In high-resolution X-ray structures, one can sometimes
resolve different side chain orientations („occupancies“)
R
e
s
o
l
u
t
i
o
n
3
V9
Processing of Biological Data
www.rcsb.org
Electron density maps for structures with
different resolutions. The first three show
tyrosine 103 from myoglobin, from entries
1a6m (1.0 Å resolution),
106m (2.0 Å resolution), and
108m (2.7 Å resolution).
The final example shows tyrosine 130 from
hemoglobin, from entry 1s0h (3.0 Å resolution).
Blue and yellow contours surround regions of
high electron density.
The atomic model is shown with sticks.
R
e
s
o
l
u
t
i
o
n
:
m
e
a
s
u
r
e
o
f
t
h
e
q
u
a
l
i
t
y
o
f
t
h
e
d
a
t
a
t
h
a
t
h
a
s
b
e
e
n
c
o
l
l
e
c
t
e
d
o
n
t
h
e
c
r
y
s
t
a
l
c
o
n
t
a
i
n
i
n
g
t
h
e
p
r
o
t
e
i
n
o
r
n
u
c
l
e
i
c
a
c
i
d
.
I
f
a
l
l
o
f
t
h
e
p
r
o
t
e
i
n
s
i
n
t
h
e
c
r
y
s
t
a
l
a
r
e
a
l
i
g
n
e
d
i
n
a
n
i
d
e
n
t
i
c
a
l
w
a
y
,
f
o
r
m
i
n
g
a
v
e
r
y
p
e
r
f
e
c
t
c
r
y
s
t
a
l
,
t
h
e
n
a
l
l
o
f
t
h
e
p
r
o
t
e
i
n
s
w
i
l
l
s
c
a
t
t
e
r
X
-
r
a
y
s
t
h
e
s
a
m
e
w
a
y
,
a
n
d
t
h
e
d
i
f
f
r
a
c
t
i
o
n
p
a
t
t
e
r
n
w
i
l
l
s
h
o
w
t
h
e
f
i
n
e
d
e
t
a
i
l
s
o
f
c
r
y
s
t
a
l
.
O
n
t
h
e
o
t
h
e
r
h
a
n
d
,
i
f
t
h
e
p
r
o
t
e
i
n
s
i
n
t
h
e
c
r
y
s
t
a
l
a
r
e
a
l
l
s
l
i
g
h
t
l
y
d
i
f
f
e
r
e
n
t
,
d
u
e
t
o
l
o
c
a
l
f
l
e
x
i
b
i
l
i
t
y
o
r
m
o
t
i
o
n
,
t
h
e
d
i
f
f
r
a
c
t
i
o
n
p
a
t
t
e
r
n
w
i
l
l
n
o
t
c
o
n
t
a
i
n
a
s
m
u
c
h
f
i
n
e
i
n
f
o
r
m
a
t
i
o
n
.
B
-
f
a
c
t
o
r
4
V9
Processing of Biological Data
http://pldserver1.biochem.queensu.ca
/~rlc/work/teaching/definitions.shtml
https://www.cgl.ucsf.edu/chimera/doc
s/UsersGuide/tutorials/bfactor.html
The "temperature-factor" or "Debye-Waller factor“ describes the degree to which the
electron density of an atom is spread out.
In theory, the B-factor indicates the true static or dynamic mobility of an atom.
However, it can also indicate where there are errors in model building.
The B-factor of atom
i
is related to its mean square displacement U
i
:
B = 8
2
U
i
2
In general, protein structures (should) have
larger B-factors in loop regions and on the
protein surface and low B-factors in
the protein core.
O
c
c
u
p
a
n
c
y
5
V9
Processing of Biological Data
Vitali et al.
Nucl Ac
Res (2002) 30,
1531–1538
1.1
Å
structure of heterogeneous nuclear ribonucleoprotein A1:
6 amino acids have alternative side chain conformations
- 3 residues are located in loop regions and are exposed to
the
solvent: Glu24, Gln36, and Lys78.
- 3 residues are located on the RNA-binding surface: Phe17 on
β1, Val44 on β2 and
Phe59 on
β3.
Phe17 side chain occupancies: 0.65 and
0.35.
P
h
e
5
9
s
i
d
e
c
h
a
i
n
o
c
c
u
p
a
n
c
i
e
s
:
0
.
5
7
a
n
d
0
.
4
3
Not
all of these conformations can be independently adopted
by these residues because of potential steric clashes.
Permissible combinations are:
(i) Phe17A/Phe59A/Val44A,B,C;
(ii) Phe17A/Phe59B/Val44A;
(iii) Phe17B/Phe59B/Val44A. These 3 combinations have
occupancies of 0.57, 0.08 and 0.35.
H
e
a
d
o
f
P
D
B
f
i
l
e
1
L
3
K
6
V9
Processing of Biological Data
Vitali et al.
Nucl Ac
Res (2002) 30,
1531–1538
REMARK 3 OTHER REFINEMENT REMARKS: RESIDUES PHE 17, VAL 44 AND PHE 59
REMARK 3 SHOW CORRELATED DISORDER IN THE SIDE CHAIN CONFORMATIONS AND
REMARK 3 THIS BEHAVIOR WAS TAKEN INTO CONSIDERATION IN REFINEMENT. THE
REMARK 3 RESIDUES WERE SPLIT IN FIVE PARTS -- B, C, D, K, L,
REMARK 3 CORRESPONDING TO THE FIVE PERMISSIBLE COMBINATIONS OF
REMARK 3 CONFORMATIONS OF PHE 17, PHE 59, AND VAL 44 …
Alternative conformations are only detected in high-resolution data.
P
D
B
f
i
l
e
1
L
3
K
7
V9
Processing of Biological Data
Vitali et al.
Nucl Ac
Res (2002) 30,
1531–1538
ATOM 338 CB
BVAL A 44
-23.016 -1.594 -1.744
0.19
17.60 C
ATOM 339 CB
CVAL A 44
-23.016 -1.594 -1.744
0.20
17.60 C
ATOM 340 CB
DVAL A 44
-23.016 -1.594 -1.744
0.18
17.60 C
ATOM 341 CB
KVAL A 44
-23.016 -1.594 -1.744
0.35
17.60 C
ATOM 342 CB
LVAL A 44
-23.016 -1.594 -1.744
0.08
17.60 C
CB has the same position in the 5 conformers
ATOM 343 CG1
BVAL A 44
-22.101 -2.293 -0.750
0.19
21.01 C
ATOM 344 CG1
CVAL A 44
-22.465 -1.845 -3.138
0.20
21.66 C
ATOM 345 CG1
DVAL A 44
-24.405 -2.206 -1.621
0.18
25.18 C
ATOM 346 CG1
KVAL A 44
-24.405 -2.206 -1.621
0.35
25.18 C
ATOM 347 CG1
LVAL A 44
-24.405 -2.206 -1.621
0.08
25.18 C
3 alternative conformations: B, C, D/K/L
D, K, L conformers have the same position, but
different occupancies
ATOM 348 CG2
BVAL A 44
-24.405 -2.206 -1.621
0.19
25.18 C
ATOM 349 CG2
CVAL A 44
-22.101 -2.293 -0.750
0.20
21.01 C
ATOM 350 CG2
DVAL A 44
-22.465 -1.845 -3.138
0.18
21.66 C
ATOM 351 CG2
KVAL A 44
-22.465 -1.845 -3.138
0.35
21.66 C
ATOM 352 CG2
LVAL A 44
-22.465 -1.845 -3.138
0.08
21.66 C
3 alternative conformations: B, C, D/K/L
D, K, L conformers have the same position
M
i
s
s
i
n
g
l
o
o
p
s
a
n
d
t
a
i
l
s
8
V9
Processing of Biological Data
www.rcsb.org
X-ray structure of SIV protease
solved without its active site
(PDB entry 1az5).
The protein contains 2 loops
(“flaps”) that were too flexible
to be detected in the
experiment (shown with stars
in the upper picture).
When the protein was
crystallized with inhibitors,
however, the loops adopted a
stable structure that may be
detected (PDB entry 1yti).
R
-
v
a
l
u
e
a
n
d
R
-
f
r
e
e
9
V9
Processing of Biological Data
www.rcsb.org
R-value is the measure of the quality of the atomic model obtained from the
crystallographic data.
When solving the structure of a protein, the researcher first builds an atomic model
and then back-calculates a simulated diffraction pattern based on that model.
The R-value measures how well the simulated diffraction pattern matches the
experimentally-observed diffraction pattern.
A totally random set of atoms will give an R-value of about 0.63,
whereas a perfect fit would have a value of 0.
Typical values of “well refined” protein structures are about 0.20.
A
l
t
e
r
n
a
t
i
v
e
c
o
n
f
o
r
m
a
t
i
o
n
s
c
o
m
p
a
t
i
b
l
e
w
i
t
h
d
a
t
a
10
V9
Processing of Biological Data
De Pristo, de
Bakker, Blundell,
Structure
12 ( 2004)
831–838
Are X-ray structures of proteins uniquely defined by the data?
Answer: only in the case of ultra-high-resolution data.
As a test, 10 and 20 independent conformers of 3 proteins were generated with a
discrete restraint-based modeling algorithm, called RAPPER, based on propensity-
weighted
φ
/
and
angle sampling of the protein backbone.
The PDB structure was used to restrain conformational sampling to only
conformations whose C coordinates were within 2
Å
of the C
atom
s of the original
PDB structures.
Further, all atoms were restrained to lie in regions of positive electron density in a
2F
obs
- F
calc
map phased with the PDB structure.
Q
u
a
l
i
t
y
o
f
a
l
t
e
r
n
a
t
i
v
e
c
o
n
f
o
r
m
a
t
i
o
n
s
11
V9
Processing of Biological Data
De Pristo, de
Bakker, Blundell,
Structure
12 ( 2004)
831–838
Alternative conformations have equal or better R
free
values than PDB structure
and lower RMS deviations of bond lengths and bond angles from the ideal values.
→
they look like “better” structures
D
i
f
f
e
r
e
n
c
e
b
e
t
w
e
e
n
m
o
d
e
l
s
a
n
d
P
D
B
s
t
r
u
c
t
u
r
e
12
V9
Processing of Biological Data
De Pristo, de
Bakker, Blundell,
Structure
12 ( 2004)
831–838
Amicyanin (1.3 Å resolution),
HIV protease (1.8 Å)
h-IL1β (2.3 Å).
Pairwise differences among the PDB
and alternate models increase with
lowered resolution
Circles: main chain RMSD
Diamonds: all-atom RMSD
Squares: rotamer state conservation :
fraction of residues with side chain χ
1
angle within 40°of the PDB structure.
B
-
f
a
c
t
o
r
s
a
n
d
R
M
S
D
p
e
r
R
e
s
i
d
u
e
f
o
r
H
I
V
P
r
o
t
e
a
s
e
13
V9
Processing of Biological Data
De Pristo, de
Bakker, Blundell,
Structure
12 ( 2004)
831–838
Averaged B factor (A) of the PDB structure (dots) and the five alternate models (line).
Note the similarity of the average B factors between the PDB and RAPPER models.
All-atom (B) and main chain (C) rmsd for each residue of the alternate models
compared to the PDB structure.
Triangles indicate residues in contact with the inhibitor molecule. The vertical dotted
line denotes the break between the two chains of the protease dimer.
M
a
i
n
C
h
a
i
n
a
n
d
S
i
d
e
C
h
a
i
n
H
e
t
e
r
o
g
e
n
e
i
t
y
i
n
H
u
m
a
n
I
n
t
e
r
l
e
u
k
i
n
-
1
β
(
2
.
3
Å
)
14
V9
Processing of Biological Data
De Pristo, de
Bakker, Blundell,
Structure
12 ( 2004)
831–838
Shown are residues 51–55 from h-
IL1
β.
The PDB structure is in magenta
and the five alternate models are
colored according to: nitrogen, blue;
oxygen, red; main chain carbon,
green; side chain carbon, yellow.
Note the pronounced backbone
variability and side chains with
anisotropic motion (Ser52, Asn53,
Lys55) and multiple discrete
conformations (Glu51, Asp54, Lys55).
M
a
i
n
C
h
a
i
n
a
n
d
S
i
d
e
C
h
a
i
n
H
e
t
e
r
o
g
e
n
e
i
t
y
i
n
H
u
m
a
n
I
n
t
e
r
l
e
u
k
i
n
-
1
β
15
V9
Processing of Biological Data
De Pristo, de
Bakker, Blundell,
Structure
12 ( 2004)
831–838
(B)–(D) show simulated-annealing
omit maps contoured at 1
σ,
for the
original PDB structure (B) and
alternate models 2 (C) and 3 (D).
→
Maps are practically
indistinguishable.
M
a
i
n
C
h
a
i
n
a
n
d
W
a
t
e
r
H
e
t
e
r
o
g
e
n
e
i
t
y
i
n
H
u
m
a
n
I
L
-
1
β
16
V9
Processing of Biological Data
De Pristo, de
Bakker, Blundell,
Structure
12 ( 2004)
831–838
Residues 137–141 from h-IL1β are shown,
highlighting backbone variability and
disordered side chains and waters.
Note the significant variability in the main
chain (Gly139 and Gly140) and side chain
(Thr137 and Lys138) conformations, while
Gln141 appears to be total disordered.
Waters H
2
O-237 and H
2
O-247 are well
ordered, whereas H
2
O-236 has a mean
square displacement of 3.5 Å.
M
i
d
-
r
a
n
g
e
r
e
s
o
l
u
t
i
o
n
s
t
r
u
c
t
u
r
e
s
d
o
n
o
t
p
r
o
v
i
d
e
u
n
i
q
u
e
i
n
f
o
r
m
a
t
i
o
n
a
b
o
u
t
a
t
o
m
i
c
p
o
s
i
t
i
o
n
s
a
n
d
r
e
l
a
t
i
v
e
o
r
i
e
n
t
a
t
i
o
n
s
.
U
l
t
r
a
h
i
g
h
r
e
s
o
l
u
t
i
o
n
s
t
r
u
c
t
u
r
e
(
0
.
4
8
Å
)
o
f
H
i
P
I
P
17
V9
Processing of Biological Data
Takeda, Miki, FEBS
J. (2017)
R
free
= 0.078! At this resolution, enormous levels of detail can be detected.
(Left) The overall structure of HiPIP is shown as a tube model, where aromatic
residues and the iron–sulfur cluster are represented as green and red sticks.
(Right) Hydrogen bonding formed between lone pair electrons of the carbonyl O of
Gly73 and the amide H atoms of Cys43.
S
t
a
t
i
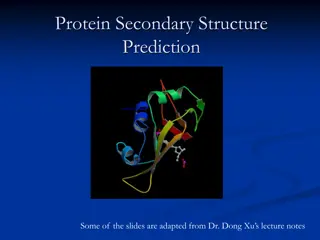
s
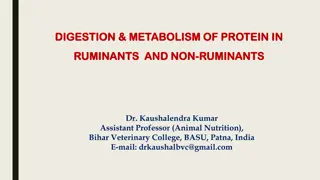
t
i
c
s
o
n
p
r
o
t
e
i
n
s
t
r
u
c
t
u
r
e
s
:
d
e
r
i
v
e
u
n
d
e
r
s
t
a
n
d
i
n
g
f
r
o
m
s
t
a
t
i
s
t
i
c
a
l
e
n
r
i
c
h
m
e
n
t
18
V9
Processing of Biological Data
Hayat et al.
Comput
Biol Chem (2011)
35, 96–107
Idea: some positions in/on protein structures are energetically more favorable for
certain amino acids
→
these amino acids should be enriched there
The energetics is difficult to estimate.
BUT the frequency of amino acids can be easily computed as a statistical average
over all known protein structures.
S
t
a
t
i
s
t
i
c
s
o
n
p
r
o
t
e
i
n
s
t
r
u
c
t
u
r
e
s
19
V9
Processing of Biological Data
Hayat et al.
Comput
Biol Chem (2011)
35, 96–107
Q: how does the amino acid composition of trans-membrane barrels (TMB) differ in
the membrane from that in the cytosol?
Split the membrane into the non-polar membrane-core (aliphatic lipid tails) and the
medium-polarity membrane interface region (phospholipid head-groups).
We compiled a non-redundant data set of known TMB structures by removing those
protein sequences for which less than 20 homologous sequences were found or
where the pair-wise sequence identity of the aligned retrieved sequences was
greater than 80%.
The final data set for TMBs comprises of 20 protein chains with 1725 and 572 TM
residues in the hydrophobic core and interface regions, respectively
P
r
o
p
e
n
s
i
t
y
s
c
a
l
e
:
o
v
e
r
/
u
n
d
e
r
-
r
e
p
r
e
s
e
n
t
a
t
i
o
n
20
V9
Processing of Biological Data
Hayat et al.
Comput
Biol Chem (2011)
35, 96–107
Logarithmic ratio of presence in membrane core for beta-barrels (BTMC) and helical
membrane proteins (HTMC)
or in interface region of membrane (BTMI and HTMI) vs. full sequence.
C
o
m
p
o
s
i
t
i
o
n
o
f
p
r
o
t
e
i
n
i
n
t
e
r
f
a
c
e
s
21
V9
Processing of Biological Data
Mohamed et al.
PLoS ONE (2015)
10, e0140965
Q: Are protein-protein interfaces comparable to protein-ligand interfaces?
Dataset : 174 protein-protein complexes and 161 protein-ligand complexes.
These complementary PP and PL datasets fulfill the following criteria:
(i) PP: PL pairs represent pairs of complexes, where one protein may bind either a
second protein or a small molecule ligand at the same interface,
(ii) every pair of the dataset is represented as (P
i1
, P
i2
): (P
i3
, L
j
), where P
i1
, P
i2
and
P
i3
are three proteins and L
j
is a small molecule ligand,
(iii) P
i1
and P
i3
share at least 40% sequence identity, and
(iv) the aligned positions in the binding interfaces of P
i1
–P
i2
and P
i3
–L
j
have at least
2 residues in
common.
P
r
o
t
e
i
n
:
l
i
g
a
n
d
i
n
t
e
r
f
a
c
e
22
V9
Processing of Biological Data
Mohamed et al.
PLoS ONE (2015)
10, e0140965
An interface residue propensity of > 1.0 indicates that a residue type occurs more
frequently in interfaces than on the protein surface in general.
F
r
e
q
u
e
n
c
i
e
s
v
s
.
p
r
o
p
e
n
s
i
t
i
e
s
23
V9
Processing of Biological Data
Mohamed et al.
PLoS ONE (2015)
10, e0140965
Frequencies are
raw counts.
Propensities are
normalized by
the proportion of
the amino acids.
Trp has overall
a low frequency,
but is frequently
found at
interfaces.
A
m
i
n
o
a
c
i
d
p
a
i
r
i
n
g
p
r
o
p
e
n
s
i
t
y
a
t
i
n
t
e
r
f
a
c
e
24
V9
Processing of Biological Data
Mohamed et al.
PLoS ONE (2015)
10, e0140965
Y – Y pairs and C – C
pairs (inter-protein
disulfide bridges) have
highest propensities.
S
t
a
t
i
s
t
i
c
a
l
p
o
t
e
n
t
i
a
l
:
B
o
l
t
z
m
a
n
n
i
n
v
e
r
s
i
o
n
25
V9
Processing of Biological Data
S
i
p
p
l
M
J
(
1
9
9
0
)
.
J
M
o
l
B
i
o
l
.
2
1
3
:
8
5
9
–
8
8
3
.
www.wikipedia.org
Probability
P(r)
at position
r
according to Boltzmann distribution as a function of the
free energy
F(r)
at this position.
k
is the Boltzmann constant,
T
is the temperature.
This can be re-arranged into
and taken with respect to a reference state with distribution Q
R
(r).
This is called a statistical potential,
e.g. from the probability to find two amino
acids at a certain distance
r
from eachother
one can derive their effective interaction free energy.
R
o
s
e
t
t
a
e
n
e
r
g
y
f
u
n
c
t
i
o
n
26
V9
Processing of Biological Data
S
i
p
p
l
M
J
(
1
9
9
0
)
.
J
M
o
l
B
i
o
l
.
2
1
3
:
8
5
9
–
8
8
3
.
www.wikipedia.org
David Baker and co-workers justified PMFs from a Bayesian point of view and
used these in the construction of the coarse grained ROSETTA energy function.
According to Bayesian probability calculus, the conditional probability
of a structure X , given the amino acid sequence A , can be written as:
is proportional to the product of the likelihood
times the prior
R
o
s
e
t
t
a
e
n
e
r
g
y
f
u
n
c
t
i
o
n
27
V9
Processing of Biological Data
S
i
p
p
l
M
J
(
1
9
9
0
)
.
J
M
o
l
B
i
o
l
.
2
1
3
:
8
5
9
–
8
8
3
.
www.wikipedia.org
By assuming that the likelihood can be approximated as a product of pairwise
probabilities, and applying Bayes' theorem, the likelihood can be written as:
where the product runs over all amino acid pairs
(with
i < j
)
, and
r
ij
is the distance between amino acids
i
and
j
.
The assumption that the likelihood
can be expressed as a product of
pairwise probabilities is
questionable.
Today's program includes examination of protein structures using X-ray crystallography, statistical analysis, and processing of biological data. The provided information covers details such as PDB files, residue numbering, atom attributes, resolution measurements, B-factors, and occupancies. Learn about the significance of electron density maps, protein mobility, and different side chain conformations in protein structures.

Download Presentation

Please find below an Image/Link to download the presentation.
The content on the website is provided AS IS for your information and personal use only. It may not be sold, licensed, or shared on other websites without obtaining consent from the author.If you encounter any issues during the download, it is possible that the publisher has removed the file from their server.
You are allowed to download the files provided on this website for personal or commercial use, subject to the condition that they are used lawfully. All files are the property of their respective owners.
The content on the website is provided AS IS for your information and personal use only. It may not be sold, licensed, or shared on other websites without obtaining consent from the author.
E N D
Presentation Transcript
V9 Protein structures Program for today: - Structures from protein X-ray crystallography - Statistics of protein structures - Statistical potentials V9 Processing of Biological Data 1
PDB files Residue number Z-coordinate Atom-number Residue type Y-coordinate X-coordinae Occupancy Atom type Chain ID B-factor ATOM 1 N ATOM 2 CA VAL E 15 -5.276 -11.431 -13.476 1.00 47.83 ATOM 3 C VAL E 15 -4.815 -10.815 -14.785 1.00 35.56 ATOM 4 O VAL E 15 -4.806 -9.592 -14.904 1.00 99.02 ATOM 5 CB VAL E 15 -4.193 -12.092 -12.629 1.00 100.00 ATOM 6 CG1 VAL E 15 -2.823 -11.529 -12.987 1.00 50.97 ATOM 7 CG2 VAL E 15 -4.494 -11.830 -11.149 1.00 35.72 ATOM 8 N LYS E 16 -4.475 -11.641 -15.778 1.00 35.94 ATOM 9 CA LYS E 16 -4.060 -11.108 -17.074 1.00 55.13 ATOM 10 C LYS E 16 -5.100 -10.105 -17.531 1.00 59.23 ATOM 11 O LYS E 16 -4.877 -9.036 -18.103 1.00 35.80 ATOM 12 CB LYS E 16 -3.916 -12.209 -18.110 1.00 47.57 ATOM 13 CG LYS E 16 -2.850 -11.886 -19.158 1.00 100.00 ATOM 14 CD LYS E 16 -1.491 -12.525 -18.888 1.00 94.01 ATOM 15 CE LYS E 16 -0.665 -11.794 -17.836 1.00 100.00 ATOM 16 NZ LYS E 16 -0.505 -12.557 -16.586 1.00 89.11 VAL E 15 -6.512 -12.177 -13.595 1.00 64.39 X-ray structure 1atp of the cAMP-dependent protein kinase In high-resolution X-ray structures, one can sometimes resolve different side chain orientations ( occupancies ) www.rcsb.org V9 Processing of Biological Data 2
Resolution Resolution : measure of the quality of the data that has been collected on the crystal containing the protein or nucleic acid. If all of the proteins in the crystal are aligned in an identical way, forming a very perfect crystal, then all of the proteins will scatter X- rays the same way, and the diffraction pattern will show the fine details of crystal. On the other hand, if the proteins in the crystal are all slightly different, due to local flexibility or motion, the diffraction pattern will not contain as much fine information. Electron density maps for structures with different resolutions. The first three show tyrosine 103 from myoglobin, from entries 1a6m (1.0 resolution), 106m (2.0 resolution), and 108m (2.7 resolution). The final example shows tyrosine 130 from hemoglobin, from entry 1s0h (3.0 resolution). Blue and yellow contours surround regions of high electron density. The atomic model is shown with sticks. www.rcsb.org V9 Processing of Biological Data 3
B-factor The "temperature-factor" or "Debye-Waller factor describes the degree to which the electron density of an atom is spread out. In theory, the B-factor indicates the true static or dynamic mobility of an atom. However, it can also indicate where there are errors in model building. The B-factor of atom i is related to its mean square displacement Ui: B = 8 2Ui2 In general, protein structures (should) have larger B-factors in loop regions and on the protein surface and low B-factors in the protein core. http://pldserver1.biochem.queensu.ca /~rlc/work/teaching/definitions.shtml https://www.cgl.ucsf.edu/chimera/doc s/UsersGuide/tutorials/bfactor.html V9 Processing of Biological Data 4
Occupancy 1.1 structure of heterogeneous nuclear ribonucleoprotein A1: 6 amino acids have alternative side chain conformations - 3 residues are located in loop regions and are exposed to the solvent: Glu24, Gln36, and Lys78. - 3 residues are located on the RNA-binding surface: Phe17 on 1, Val44 on 2 and Phe59 on 3. Phe17 side chain occupancies: 0.65 and 0.35. Phe59 side chain occupancies: 0.57 and 0.43 Not all of these conformations can be independently adopted by these residues because of potential steric clashes. Permissible combinations are: (i) Phe17A/Phe59A/Val44A,B,C; (ii) Phe17A/Phe59B/Val44A; (iii) Phe17B/Phe59B/Val44A. These 3 combinations have occupancies of 0.57, 0.08 and 0.35. Vitali et al. Nucl Ac Res (2002) 30, 1531 1538 V9 Processing of Biological Data 5
Head of PDB file 1L3K REMARK 3 OTHER REFINEMENT REMARKS: RESIDUES PHE 17, VAL 44 AND PHE 59 REMARK 3 SHOW CORRELATED DISORDER IN THE SIDE CHAIN CONFORMATIONS AND REMARK 3 THIS BEHAVIOR WAS TAKEN INTO CONSIDERATION IN REFINEMENT. THE REMARK 3 RESIDUES WERE SPLIT IN FIVE PARTS -- B, C, D, K, L, REMARK 3 CORRESPONDING TO THE FIVE PERMISSIBLE COMBINATIONS OF REMARK 3 CONFORMATIONS OF PHE 17, PHE 59, AND VAL 44 Alternative conformations are only detected in high-resolution data. Vitali et al. Nucl Ac Res (2002) 30, 1531 1538 V9 Processing of Biological Data 6
PDB file 1L3K -23.016 -1.594 -1.744 0.19 -23.016 -1.594 -1.744 0.20 -23.016 -1.594 -1.744 0.18 -23.016 -1.594 -1.744 0.35 -23.016 -1.594 -1.744 0.08 CB has the same position in the 5 conformers ATOM 338 CB ATOM 339 CB ATOM 340 CB ATOM 341 CB ATOM 342 CB BVAL A 44 CVAL A 44 DVAL A 44 KVAL A 44 LVAL A 44 17.60 C 17.60 C 17.60 C 17.60 C 17.60 C ATOM 343 CG1 ATOM 344 CG1 ATOM 345 CG1 ATOM 346 CG1 ATOM 347 CG1 BVAL A 44 CVAL A 44 DVAL A 44 KVAL A 44 LVAL A 44 -22.101 -2.293 -0.750 0.19 -22.465 -1.845 -3.138 0.20 -24.405 -2.206 -1.621 0.18 -24.405 -2.206 -1.621 0.35 -24.405 -2.206 -1.621 0.08 3 alternative conformations: B, C, D/K/L D, K, L conformers have the same position, but different occupancies 21.01 C 21.66 C 25.18 C 25.18 C 25.18 C ATOM 348 CG2 ATOM 349 CG2 ATOM 350 CG2 ATOM 351 CG2 ATOM 352 CG2 BVAL A 44 CVAL A 44 DVAL A 44 KVAL A 44 LVAL A 44 -24.405 -2.206 -1.621 0.19 -22.101 -2.293 -0.750 0.20 -22.465 -1.845 -3.138 0.18 -22.465 -1.845 -3.138 0.35 -22.465 -1.845 -3.138 0.08 3 alternative conformations: B, C, D/K/L D, K, L conformers have the same position 25.18 C 21.01 C 21.66 C 21.66 C 21.66 C Vitali et al. Nucl Ac Res (2002) 30, 1531 1538 V9 Processing of Biological Data 7
Missing loops and tails X-ray structure of SIV protease solved without its active site (PDB entry 1az5). The protein contains 2 loops ( flaps ) that were too flexible to be detected in the experiment (shown with stars in the upper picture). When the protein was crystallized with inhibitors, however, the loops adopted a stable structure that may be detected (PDB entry 1yti). www.rcsb.org V9 Processing of Biological Data 8
R-value and R-free R-value is the measure of the quality of the atomic model obtained from the crystallographic data. When solving the structure of a protein, the researcher first builds an atomic model and then back-calculates a simulated diffraction pattern based on that model. The R-value measures how well the simulated diffraction pattern matches the experimentally-observed diffraction pattern. A totally random set of atoms will give an R-value of about 0.63, whereas a perfect fit would have a value of 0. Typical values of well refined protein structures are about 0.20. www.rcsb.org V9 Processing of Biological Data 9
Alternative conformations compatible with data Are X-ray structures of proteins uniquely defined by the data? Answer: only in the case of ultra-high-resolution data. As a test, 10 and 20 independent conformers of 3 proteins were generated with a discrete restraint-based modeling algorithm, called RAPPER, based on propensity- weighted / and angle sampling of the protein backbone. The PDB structure was used to restrain conformational sampling to only conformations whose C coordinates were within 2 of the C atoms of the original PDB structures. Further, all atoms were restrained to lie in regions of positive electron density in a 2Fobs- Fcalcmap phased with the PDB structure. De Pristo, de Bakker, Blundell, Structure 12 ( 2004) 831 838 V9 Processing of Biological Data 10
Quality of alternative conformations Alternative conformations have equal or better Rfreevalues than PDB structure and lower RMS deviations of bond lengths and bond angles from the ideal values. they look like better structures De Pristo, de Bakker, Blundell, Structure 12 ( 2004) 831 838 V9 Processing of Biological Data 11
Difference between models and PDB structure Amicyanin (1.3 resolution), HIV protease (1.8 ) h-IL1 (2.3 ). Pairwise differences among the PDB and alternate models increase with lowered resolution Circles: main chain RMSD Diamonds: all-atom RMSD Squares: rotamer state conservation : fraction of residues with side chain 1 angle within 40 of the PDB structure. De Pristo, de Bakker, Blundell, Structure 12 ( 2004) 831 838 V9 Processing of Biological Data 12
B-factors and RMSD per Residue for HIV Protease De Pristo, de Bakker, Blundell, Structure 12 ( 2004) 831 838 Averaged B factor (A) of the PDB structure (dots) and the five alternate models (line). Note the similarity of the average B factors between the PDB and RAPPER models. All-atom (B) and main chain (C) rmsd for each residue of the alternate models compared to the PDB structure. Triangles indicate residues in contact with the inhibitor molecule. The vertical dotted line denotes the break between the two chains of the protease dimer. V9 Processing of Biological Data 13
Main Chain and Side Chain Heterogeneity in Human Interleukin-1 (2.3 ) Shown are residues 51 55 from h- IL1 . The PDB structure is in magenta and the five alternate models are colored according to: nitrogen, blue; oxygen, red; main chain carbon, green; side chain carbon, yellow. Note the pronounced backbone variability and side chains with anisotropic motion (Ser52, Asn53, Lys55) and multiple discrete conformations (Glu51, Asp54, Lys55). De Pristo, de Bakker, Blundell, Structure 12 ( 2004) 831 838 V9 Processing of Biological Data 14
Main Chain and Side Chain Heterogeneity in Human Interleukin-1 (B) (D) show simulated-annealing omit maps contoured at 1 , for the original PDB structure (B) and alternate models 2 (C) and 3 (D). Maps are practically indistinguishable. De Pristo, de Bakker, Blundell, Structure 12 ( 2004) 831 838 V9 Processing of Biological Data 15
Main Chain and Water Heterogeneity in Human IL-1 Residues 137 141 from h-IL1 are shown, highlighting backbone variability and disordered side chains and waters. Note the significant variability in the main chain (Gly139 and Gly140) and side chain (Thr137 and Lys138) conformations, while Gln141 appears to be total disordered. Waters H2O-237 and H2O-247 are well ordered, whereas H2O-236 has a mean square displacement of 3.5 . Mid-range resolution structures do not provide unique information about atomic positions and relative orientations. De Pristo, de Bakker, Blundell, Structure 12 ( 2004) 831 838 V9 Processing of Biological Data 16
Ultra high resolution structure (0.48 ) of HiPIP Rfree= 0.078! At this resolution, enormous levels of detail can be detected. (Left) The overall structure of HiPIP is shown as a tube model, where aromatic residues and the iron sulfur cluster are represented as green and red sticks. (Right) Hydrogen bonding formed between lone pair electrons of the carbonyl O of Gly73 and the amide H atoms of Cys43. Takeda, Miki, FEBS J. (2017) V9 Processing of Biological Data 17
Statistics on protein structures: derive understanding from statistical enrichment Idea: some positions in/on protein structures are energetically more favorable for certain amino acids these amino acids should be enriched there The energetics is difficult to estimate. BUT the frequency of amino acids can be easily computed as a statistical average over all known protein structures. Hayat et al. Comput Biol Chem (2011) 35, 96 107 V9 Processing of Biological Data 18
Statistics on protein structures Q: how does the amino acid composition of trans-membrane barrels (TMB) differ in the membrane from that in the cytosol? Split the membrane into the non-polar membrane-core (aliphatic lipid tails) and the medium-polarity membrane interface region (phospholipid head-groups). We compiled a non-redundant data set of known TMB structures by removing those protein sequences for which less than 20 homologous sequences were found or where the pair-wise sequence identity of the aligned retrieved sequences was greater than 80%. The final data set for TMBs comprises of 20 protein chains with 1725 and 572 TM residues in the hydrophobic core and interface regions, respectively Hayat et al. Comput Biol Chem (2011) 35, 96 107 V9 Processing of Biological Data 19
Propensity scale: over / under-representation Logarithmic ratio of presence in membrane core for beta-barrels (BTMC) and helical membrane proteins (HTMC) or in interface region of membrane (BTMI and HTMI) vs. full sequence. Hayat et al. Comput Biol Chem (2011) 35, 96 107 V9 Processing of Biological Data 20
Composition of protein interfaces Q: Are protein-protein interfaces comparable to protein-ligand interfaces? Dataset : 174 protein-protein complexes and 161 protein-ligand complexes. These complementary PP and PL datasets fulfill the following criteria: (i) PP: PL pairs represent pairs of complexes, where one protein may bind either a second protein or a small molecule ligand at the same interface, (ii) every pair of the dataset is represented as (Pi1, Pi2): (Pi3, Lj), where Pi1, Pi2and Pi3are three proteins and Ljis a small molecule ligand, (iii) Pi1and Pi3share at least 40% sequence identity, and (iv) the aligned positions in the binding interfaces of Pi1 Pi2and Pi3 Ljhave at least 2 residues in common. Mohamed et al. PLoS ONE (2015) 10, e0140965 V9 Processing of Biological Data 21
Protein:ligand interface An interface residue propensity of > 1.0 indicates that a residue type occurs more frequently in interfaces than on the protein surface in general. Mohamed et al. PLoS ONE (2015) 10, e0140965 V9 Processing of Biological Data 22
Frequencies vs. propensities Frequencies are raw counts. Propensities are normalized by the proportion of the amino acids. Trp has overall a low frequency, but is frequently found at interfaces. Mohamed et al. PLoS ONE (2015) 10, e0140965 V9 Processing of Biological Data 23
Amino acid pairing propensity at interface Y Y pairs and C C pairs (inter-protein disulfide bridges) have highest propensities. Mohamed et al. PLoS ONE (2015) 10, e0140965 V9 Processing of Biological Data 24
Statistical potential: Boltzmann inversion Probability P(r) at position r according to Boltzmann distribution as a function of the free energy F(r) at this position. k is the Boltzmann constant, T is the temperature. This can be re-arranged into and taken with respect to a reference state with distribution QR(r). This is called a statistical potential, e.g. from the probability to find two amino acids at a certain distance r from eachother one can derive their effective interaction free energy. Sippl MJ (1990). J Mol Biol. 213: 859 883. www.wikipedia.org V9 Processing of Biological Data 25
Rosetta energy function David Baker and co-workers justified PMFs from a Bayesian point of view and used these in the construction of the coarse grained ROSETTA energy function. According to Bayesian probability calculus, the conditional probability of a structure X , given the amino acid sequence A , can be written as: is proportional to the product of the likelihood times the prior Sippl MJ (1990). J Mol Biol. 213: 859 883. www.wikipedia.org V9 Processing of Biological Data 26
Rosetta energy function By assuming that the likelihood can be approximated as a product of pairwise probabilities, and applying Bayes' theorem, the likelihood can be written as: where the product runs over all amino acid pairs (with i < j ), and rij is the distance between amino acids iand j. The assumption that the likelihood can be expressed as a product of pairwise probabilities is questionable. Sippl MJ (1990). J Mol Biol. 213: 859 883. www.wikipedia.org V9 Processing of Biological Data 27


 of HiPIP")