Preliminary New Student Enrollment Update Fall 2022 Highlights
Fall 2022 enrollment data for UConn showcases the diversity among first-year students, financial aid highlights, and key statistics regarding transfers and Pell Grant recipients. The numbers reflect a growing trend of minority representation, test-optional admissions, and financial aid percentages over the past few years.

Download Presentation

Please find below an Image/Link to download the presentation.
The content on the website is provided AS IS for your information and personal use only. It may not be sold, licensed, or shared on other websites without obtaining consent from the author.If you encounter any issues during the download, it is possible that the publisher has removed the file from their server.
You are allowed to download the files provided on this website for personal or commercial use, subject to the condition that they are used lawfully. All files are the property of their respective owners.
The content on the website is provided AS IS for your information and personal use only. It may not be sold, licensed, or shared on other websites without obtaining consent from the author.
E N D
Presentation Transcript
Preliminary New Student Enrollment Update Fall 2022 1
Fall 2022 Highlights Storrs First Year: 4,089 9.5% of First Year Students are Ethnic & Racial Minorities 49.6% 59.4% CT Residents International Students 1.5% 25% Federal Pell Recipients 19.6% 13.7% 19% 30 ACT 554 Honors Students 1316 SAT* 28.5% First Generation 0.5% 55.6% Individual percentages add to greater than 49.6%, because a growing number of students identify with multiple races or ethnicities. Preliminary Data * As a result of Test Optional, less than half of the entering students submitted test scores 2
Fall 2022 Highlights Regional First Year: 1,746 of First Year Students are Ethnic & Racial Minorities 57% 1.9% 92% CT Residents 48% Federal Pell Recipients 15.1% 22.2% 25% 49.7% First Generation 30 Stamford Honors Students 1111 SAT* 0.6% 45.9% Individual percentages add to greater than 57%, because a growing number of students identify with multiple races or ethnicities. Preliminary Data * As a result of Test Optional, less than half of the entering students submitted test scores 3
Fall 2022 Highlights Transfer Students: 937 706 Transfers at Storrs 231 Transfers at the regional campuses Transfers from 277 colleges & universities (Including all 12 Connecticut Community Colleges) 86.6% are Connecticut residents; 13.4% nonresidents 30% are Federal Pell Grant Recipients Preliminary Data 4
New Student Financial Aid Highlights Fall 2019 Fall 2020 Fall 2021 Fall 2022 New First Years receiving Federal Pell Grant 33% 33% 31% 29% New First Years receiving some form of financial aid (loans, grants, scholarships, etc.) 87% 85% 87% 84% New Transfers receiving Federal Pell Grant 30% 34% 33% 30% New Transfers receiving some form of financial aid (loans, grants, scholarships, etc.) 74% 75% 70% 75% Preliminary Data
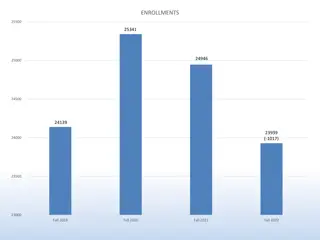
Fall 2022 Enrollment Summary Fall 2021 Actual Fall 2022 Target Fall 2022 Actual Storrs First Year 3,663 3,900 4089 Storrs Transfers 638 650 706 Regional First Year 1,586 1,625 1647 Storrs Spring Admission 214 145 99 Regional Transfers 206 200 231 Total New Students 6,307 6,704 6,772 Fall 2020 Fall 2021 Fall 2022 Total Undergraduates* 23,952 23,518 23,715 Preliminary Data * Degree Seeking Only 6
Questions? Nathan Fuerst, Vice President Division of Enrollment Planning & Management nathan.fuerst@uconn.edu 486-1463 Fall 2023 Class https://admissions.uconn.edu/ STORRS FALL CAMPUS VISIT DAYS SUNDAY, OCTOBER 2, 2022 SATURDAY, OCTOBER 15, 2022 10:00 a.m. - 3:00 p.m. https://admissions.uconn.edu/open-house/ 7