Fresno State Fall 2015-2016 Enrollment Update


Fall 2015-2016
Fall 2015-2016
Fresno State Enrollment Update
Fresno State Enrollment Update
High School Counselor Conference
October 30, 2015


Fall 2015
Total
Enrollment
•
Headcount:
24,136
•
Full Time Equivalent
–
Resident Student Target: 20,533
–
Resident Student Actual: 21,057 (102.5%)
•
Average Unit Load:
13.2
First Time
Freshman
(FTF) Profile
•
Applicant Numbers
o
Applications:
19,938
o
Admitted:
10,406
(51.6% of applicants)
o
Enrolled:
3,672
(35.3% of admits)
•
Enrollment by Region
o
Fresno County 2,043/ 55.6%
o
Central Valley 465/
12.7%
o
Other Ca.
961/ 26.1%
o
Outside CA 151/ 4.1%
(domestic)
o
International 52/ 1.4%
Fall 2015
Top Feeder High Schools (Enrolled Students)
•
167 Sunnyside HS
•
129 Central High East
•
119 Edison HS
•
112 Sanger HS
•
103 Clovis HS
•
101 Fresno HS
•
101 McLane HS
•
96 Clovis East HS
•
90 Buchannan HS
•
87 Roosevelt HS
•
82 Madera South HS
•
78 Bullard HS
•
77 Hoover HS
•
72 Clovis West HS
•
70 Clovis North HS
•
66 Madera North HS
•
55 Washington HS
•
54 Duncan Polytech HS
•
54 Kerman HS
•
50 Mission Oak HS
•
49 Selma HS
•
44 Dinuba HS
•
42 Fowler HS
•
42 Reedley HS
Fall 2015
Freshman Enrollment by School/College
Fall 2015 Freshman Enrollment by Ethnicity
Fall 2015 Freshman Enrollment by Gender
Impaction Update
•
Starting Fall 2016: Full Program Impaction
–
Why?
•
Significant Enrollment Growth
•
Budget Restrictions
–
What does it mean?
•
Adjustment of admission requirements
•
Fresno State will use
minimal
impaction tools
Fresno State's Fall 2015 enrollment update reveals a total headcount of 24,136 with a strong representation of first-time freshmen from various high schools and diverse ethnicities. The enrollment by gender shows a distribution of 40.4% male and 59.6% female students. Impaction updates for Fall 2016 aim to address significant enrollment growth and budget restrictions by adjusting admission requirements.

Download Presentation

Please find below an Image/Link to download the presentation.
The content on the website is provided AS IS for your information and personal use only. It may not be sold, licensed, or shared on other websites without obtaining consent from the author.If you encounter any issues during the download, it is possible that the publisher has removed the file from their server.
You are allowed to download the files provided on this website for personal or commercial use, subject to the condition that they are used lawfully. All files are the property of their respective owners.
The content on the website is provided AS IS for your information and personal use only. It may not be sold, licensed, or shared on other websites without obtaining consent from the author.
E N D
Presentation Transcript
Fall 2015-2016 Fresno State Enrollment Update High School Counselor Conference October 30, 2015
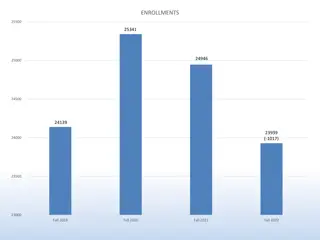
Fall 2015 Total Enrollment Headcount: 24,136 Full Time Equivalent Resident Student Target: 20,533 Resident Student Actual: 21,057 (102.5%) Average Unit Load: 13.2
First Time Freshman (FTF) Profile 4%1% Applicant Numbers o Applications: 19,938 o Admitted: 10,406 26% (51.6% of applicants) 3,672 o Enrolled: 56% (35.3% of admits) Enrollment by Region o Fresno County 2,043/ 55.6% o Central Valley 465/ 12.7% o Other Ca. o Outside CA 151/ 4.1% (domestic) o International 52/ 1.4% 13% Fresno County Central Valley Other Ca. Outside CA (Domestic) International 961/ 26.1%
Fall 2015 Top Feeder High Schools (Enrolled Students) 167 Sunnyside HS 129 Central High East 119 Edison HS 112 Sanger HS 103 Clovis HS 101 Fresno HS 101 McLane HS 96 Clovis East HS 90 Buchannan HS 87 Roosevelt HS 82 Madera South HS 78 Bullard HS 77 Hoover HS 72 Clovis West HS 70 Clovis North HS 66 Madera North HS 55 Washington HS 54 Duncan Polytech HS 54 Kerman HS 50 Mission Oak HS 49 Selma HS 44 Dinuba HS 42 Fowler HS 42 Reedley HS
Fall 2015 Freshman Enrollment by School/College School/College Enrolled % College of Health and Human Services 777 21.2% College of Science and Mathematics College of Social Sciences 693 433 18.9% 11.8% Craig School of Business 369 10.0% Lyles College of Engineering Undeclared Jordan College of Agricultural Sciences and Technology College of Arts and Humanities Kremen School of Education and Human Development 359 333 9.8% 9.1% 291 7.9% 258 7.0% 159 4.3%
Fall 2015 Freshman Enrollment by Ethnicity Ethnicity AfricanAmerican American Indian Asian Hispanic Non-Resident Alien Pacific Islanders Two or More Unknown White Enrolled 110 10 513 2,079 190 % 3.0% 0.3% 14.0% 56.6% 5.2% .1% 2.6% 3.4% 14.8% 4 97 125 544
Fall 2015 Freshman Enrollment by Gender Gender % Male 40.4% Female 59.6%
Impaction Update Starting Fall 2016: Full Program Impaction Why? Significant Enrollment Growth Budget Restrictions What does it mean? Adjustment of admission requirements Fresno State will use minimal impaction tools


 Profile")