Polynomials and Quadratics in Mathematics

MATH 1311
Section 5.5
Additional Popper 33: Answer A for #1 – 10

Polynomials and Rational Functions
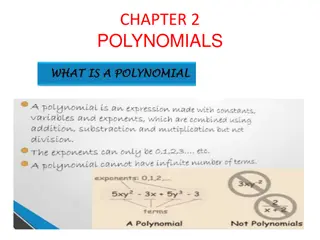
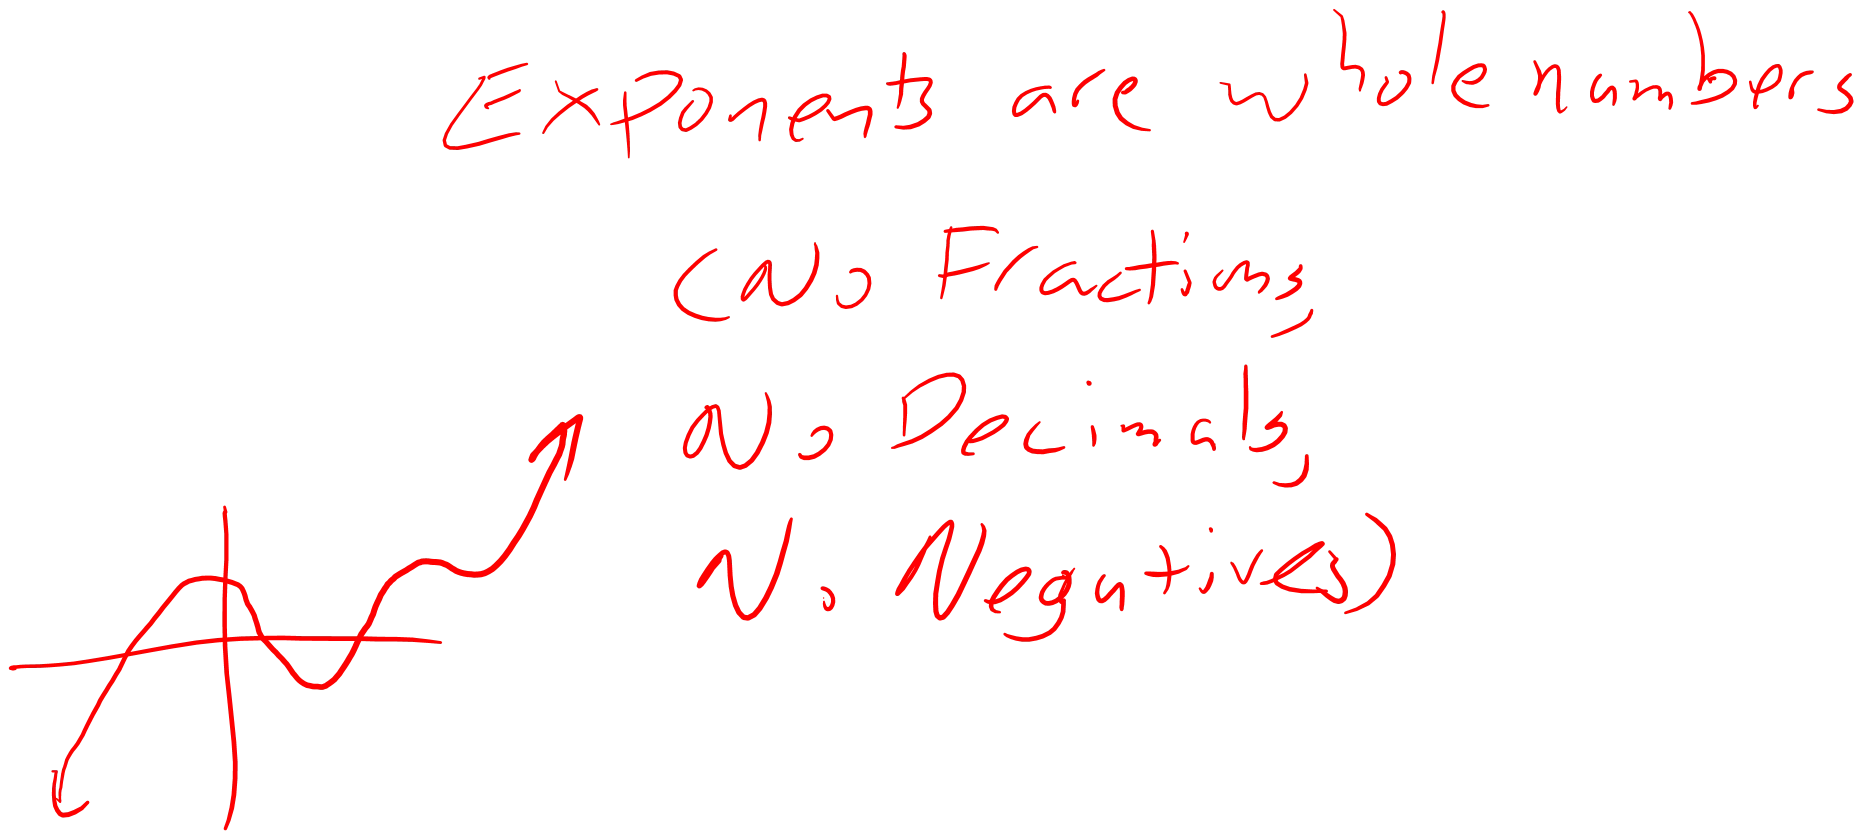
A polynomial function is defined as a series of power functions that
have been added or subtracted.
For example:
p(x) = 5x
4
+ 2x
3
+ 8x – 3
is a polynomial function.
Quadratics
Quadratic functions are polynomial functions of degree 2, meaning that
the largest exponent value is a 2.
For example:
f(x) = 3x
2
+ 5x – 2
is a quadratic function.
The Quadratic Formula:
Find the x-intercepts of f(x) = 3x
2
+ 5x – 2
Direction of a parabola.
A parabola (the graph of a quadratic function) is a U-shaped graph. The
sign of the leading coefficient determines the direction of the graph.
y = 2x
2
– 4x + 1
y = -x
2
+ 3x + 2
Example:
A ball is thrown from a height of 25 feet, at an initial velocity of 12 feet
per second. The equation of the ball’s height above the ground is given
by:
h(t) = -16t
2
+ 12t + 25
h(t) = -16t
2
+ v
0
t + h
0
Determine when the ball will hit the ground.
Determine when it will reach its maximum height.
What is the maximum height?
Modelling Near Quadratic Data
As before, to model quadratic data, you must input into STAT
Edit
under L1 and L2. From this point, you QuadReg to find the values of a,
b, and c for the following format:
y = ax
2
+ bx + c
Example:
A company is trying out a new marketing campaign. To assess the
value of this campaign, the marketing rep is monitoring sales by day
after the campaign launched.
Find the quadratic regression for this data.
Where would sales have been the lowest?
Estimate the sales for 13 days after the campaign launch.
Higher degree polynomials:
Polynomials with degrees larger than 2 can by modelled as well;
Cubic equations: 3
rd
degree: f(x) = 2x
3
+ 7x
2
– 2x + 1
Quartic equations: 4
th
degree: g(x) = x
4
– 2x
3
+ 6x
2
+ 8x – 3
Both of these can be modelled in the graphing calculator using the
same process as before.
Popper 31
The height of a ball is monitored every second after its launch. The data is
given in the table below:
1.
Create the quadratic regression for this data.
a. y = 7.2x
2
+ 1.2x – 5.3
b. y = -0.1x
2
+ 2.4x + 6.2
c. y = -0.74x
2
+ 6.13x + 3.35
d. y = -.8x
2
+ 5.2x – 0.32
2. When will the ball obtain its maximum height?
a. 3.3 sec
b. 4.1 sec
c. 8.8 sec
d. 16.1 sec
3. What is the maximum height?
a. 3.3 ft
b. 4.1 ft
c. 8.8 ft
d. 16.0 ft
4. When will the ball hit the ground?
a. 3.3 sec
b. 4.1 sec
c. 8.8 sec
d. 16.1 sec
Rational Functions:
Key Features of a Rational Function:
Horizontal Asymptote: this is the levelling out value occurring at the far
left and far right of the function. (Occurs if the degree of the
denominator is equal or larger than the degree of the numerator).
Key Features of a Rational Function:
Vertical Asymptote (or Pole): Breaks in the graph where the y-values go
to positive or negative infinity. (These occur when the denominator
equals zero, but the numerator does not.)
Key Features of a Rational Function:
Removable Discontinuities (or Holes): Single point undefined values
that don’t affect the general appearance of the graph. (These occur
when both numerator and denominator equal zero.)
The world of polynomials and quadratics with definitions, examples, and formulas. Understand polynomial functions and quadratic functions, including the quadratic formula and finding x-intercepts. Discover the direction of a parabola and how to model quadratic data in real-world scenarios.

Download Presentation

Please find below an Image/Link to download the presentation.
The content on the website is provided AS IS for your information and personal use only. It may not be sold, licensed, or shared on other websites without obtaining consent from the author.If you encounter any issues during the download, it is possible that the publisher has removed the file from their server.
You are allowed to download the files provided on this website for personal or commercial use, subject to the condition that they are used lawfully. All files are the property of their respective owners.
The content on the website is provided AS IS for your information and personal use only. It may not be sold, licensed, or shared on other websites without obtaining consent from the author.
E N D
Presentation Transcript
MATH 1311 Section 5.5 Additional Popper 33: Answer A for #1 10
Polynomials and Rational Functions A polynomial function is defined as a series of power functions that have been added or subtracted. For example: p(x) = 5x4+ 2x3+ 8x 3 is a polynomial function.
Quadratics Quadratic functions are polynomial functions of degree 2, meaning that the largest exponent value is a 2. For example: f(x) = 3x2+ 5x 2 is a quadratic function.
The Quadratic Formula: The solution to the quadratic equation: ax2+ bx + c = 0 will always be: ? = ? ?2 4?? 2?
Find the x-intercepts of f(x) = 3x2+ 5x 2 ? = ? ?2 4?? 2?
Direction of a parabola. A parabola (the graph of a quadratic function) is a U-shaped graph. The sign of the leading coefficient determines the direction of the graph. y = 2x2 4x + 1 y = -x2 + 3x + 2
Example: A ball is thrown from a height of 25 feet, at an initial velocity of 12 feet per second. The equation of the ball s height above the ground is given by: h(t) = -16t2 + 12t + 25 h(t) = -16t2 + v0t + h0 Determine when the ball will hit the ground. Determine when it will reach its maximum height. What is the maximum height?
Modelling Near Quadratic Data As before, to model quadratic data, you must input into STAT Edit under L1 and L2. From this point, you QuadReg to find the values of a, b, and c for the following format: y = ax2 + bx + c
Example: A company is trying out a new marketing campaign. To assess the value of this campaign, the marketing rep is monitoring sales by day after the campaign launched. Find the quadratic regression for this data. Where would sales have been the lowest? Estimate the sales for 13 days after the campaign launch.
Higher degree polynomials: Polynomials with degrees larger than 2 can by modelled as well; Cubic equations: 3rd degree: f(x) = 2x3 + 7x2 2x + 1 Quartic equations: 4th degree: g(x) = x4 2x3 + 6x2 + 8x 3 Both of these can be modelled in the graphing calculator using the same process as before.
Popper 31 The height of a ball is monitored every second after its launch. The data is given in the table below: 1. Create the quadratic regression for this data. a. y = 7.2x2 + 1.2x 5.3 c. y = -0.74x2 + 6.13x + 3.35 d. y = -.8x2 + 5.2x 0.32 2. When will the ball obtain its maximum height? a. 3.3 sec b. 4.1 sec 3. What is the maximum height? a. 3.3 ft b. 4.1 ft 4. When will the ball hit the ground? a. 3.3 sec b. 4.1 sec b. y = -0.1x2 + 2.4x + 6.2 c. 8.8 sec d. 16.1 sec c. 8.8 ft d. 16.0 ft c. 8.8 sec d. 16.1 sec
Rational Functions: Rational Functions are formed by dividing two polynomial functions. For example: ? + 3 ? ? = ?2+ 8? + 15 is a Rational Function.
Key Features of a Rational Function: Horizontal Asymptote: this is the levelling out value occurring at the far left and far right of the function. (Occurs if the degree of the denominator is equal or larger than the degree of the numerator).
Key Features of a Rational Function: Vertical Asymptote (or Pole): Breaks in the graph where the y-values go to positive or negative infinity. (These occur when the denominator equals zero, but the numerator does not.)
Key Features of a Rational Function: Removable Discontinuities (or Holes): Single point undefined values that don t affect the general appearance of the graph. (These occur when both numerator and denominator equal zero.)


 = 3x2+ 5x – 2")