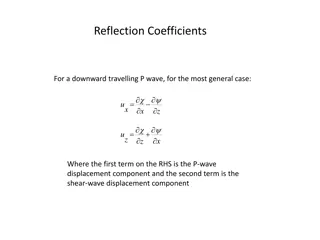
Polynomials: Degrees, Coefficients, and Graphs
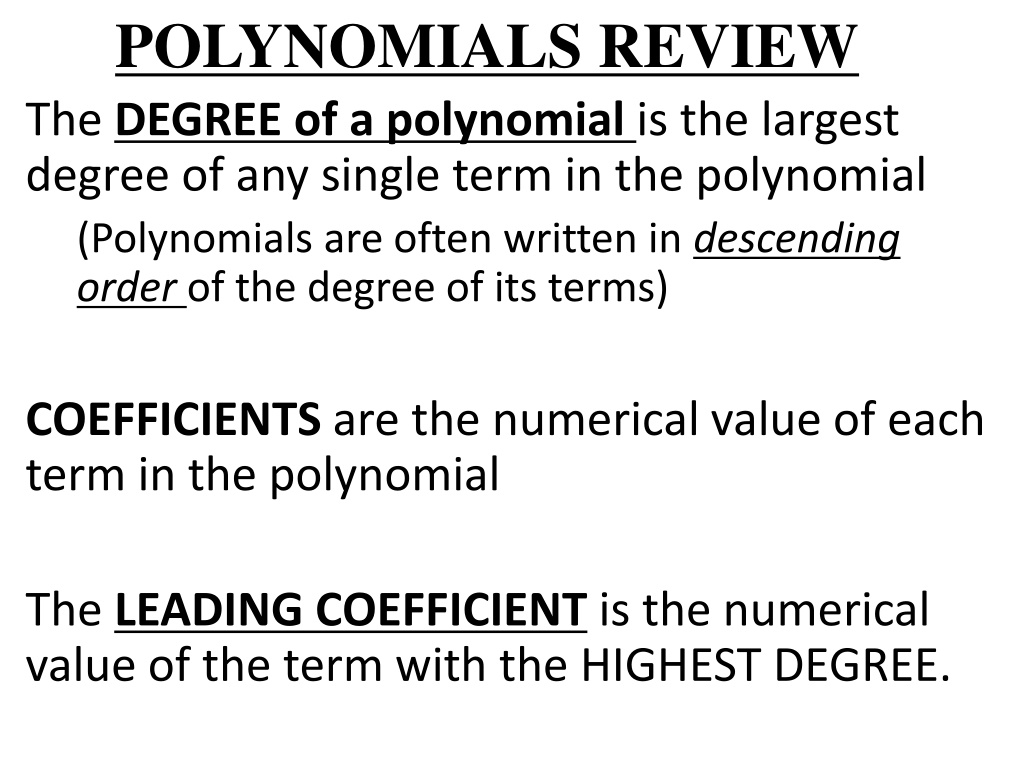
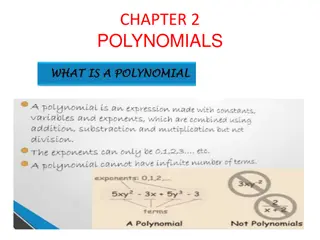
POLYNOMIALS REVIEW
The
DEGREE of a polynomial
is the largest
degree of any single term in the polynomial
(Polynomials are often written in
descending
order
of the degree of its terms)
COEFFICIENTS
are the numerical value of each
term in the polynomial
The
LEADING COEFFICIENT
is the numerical
value of the term with the HIGHEST DEGREE.
Polynomials Review Practice
For each polynomial
1)
Write the polynomial in descending order
2)
Identify the DEGREE and LEADING COEFFICIENT
of the polynomial
Finding values of a polynomial
:
Substitute values of
x
into polynomial and simplify:
Find each value for
1.
2.
3.
4.
Graphs of Polynomial Functions:
Constant Function
Linear Function
Quadratic Function
(degree = 0)
(degree = 1)
(degree = 2)
Cubic Function
Quartic Function
Quintic Function
(deg. = 3)
(deg. = 4)
(deg. = 5)
OBSERVATIONS of Polynomial Graphs:
1) How does the degree of a polynomial function relate the
number of roots of the graph?
2) Is there any relationship between the degree of the
polynomial function and the shape of the graph?
OBSERVATIONS of Polynomial Graphs:
3) What additional information (value) related the degree of
the polynomial may affect the shape of its graph?
Describe possible shape of the following based on the
degree and leading coefficient:
Degree Practice with Polynomial Functions
•
Identify the degree as odd or even and state the assumed degree.
•
Identify leading coefficient as positive or negative.
Draw a graph for each descriptions:
Description #1:
Degree = 4
Leading Coefficient = 2
Description #2:
Degree = 6
Leading Coefficient = -3
Description #3:
Degree = 3
Leading Coefficient = 1
Description
#4:
Degree = 8
Leading
Coefficient
= -2
Description
#5:
Degree = 5
Leading
Coefficient
= -4
Graphs # 1 – 6 Identify RANGE:
Interval or Inequality Notation
(
1
,
4
)
(
-
5
,
-
9
)
(
-
6
,
-
9
)
(
4
,
-
1
5
)
(
-
2
,
8
)
(
0
,
1
1
)
(
1
3
,
9
)
(
7
,
-
2
)
(
-
1
7
,
-
1
0
)
(
-
3
,
3
)
(
-
5
,
-
4
)
(
1
,
-
9
)
(
6
,
1
1
)
(
-
3
,
1
2
)
(
1
,
-
3
)
(
2
,
2
)
(
4
,
-
5
)
(
1
,
1
2
)
(
-
5
,
1
7
)
(
-
2
,
6
)
(
3
,
2
)
(
4
,
8
)
Graph #1
Graph #2
Graph #3
Graph #4
Graph #5
Graph #6
The
END BEHAVIOR
of a polynomial
describes
the
RANGE
, f(x), as the
DOMAIN
, x, moves
LEFT
(as
x
approaches negative infinity: x
→ - ∞
) and
RIGHT
(as
x
approaches positive infinity : x
→ ∞
)
on the graph.
Determine the end behavior for each of the given graphs
Right
:
Left
:
Right
:
Left
:
Use Graphs #1 – 6 from the previous Slide
GRAPH #1
•
Describe the END BEHAVIOR of each graph
•
Identify if the degree is EVEN or ODD for the graph
•
Identify if the leading coefficient is POSITIVE or NEGATIVE
Degree:
EVEN or ODD
Leading Coefficient:
POS or NEG
GRAPH #2
GRAPH #3
GRAPH #4
GRAPH #5
GRAPH #6
Describing Polynomial Graphs Based on the Equation
Based on the given polynomial function:
•
Identify the
Leading Coefficient
and
Degree
.
•
Sketch possible graph
(Hint: How many direction changes possible?)
•
Identify the END BEHAVIOR
•
Point A
is a
Relative Maximum
because it
is the highest point in the immediate area
(not the highest point on the entire graph).
•
Point B
is a
Relative Minimum
because it
is the lowest point in the immediate area
(not the lowest point on the entire graph).
•
Point C
is the
Absolute Maximum
because it is the highest point on the entire
graph.
•
There is no
Absolute Minimum
on this
graph because the end behavior is:
(there is no bottom point)
EXTREMA
: MAXIMUM
and
MINIMUM
points are the highest and lowest points on the graph.
Identify ALL Maximum or Minimum Points
Distinguish if each is RELATIVE (R) or ABSOLUTE (A)
(
-
6
,
-
9
)
(
4
,
-
1
5
)
(
-
2
,
8
)
(
0
,
1
1
)
(
1
3
,
9
)
(
7
,
-
2
)
(
-
1
7
,
-
1
0
)
(
-
3
,
3
)
(
-
5
,
-
4
)
(
1
,
-
9
)
(
6
,
1
1
)
(
-
3
,
1
2
)
(
1
,
-
3
)
(
2
,
2
)
(
4
,
-
5
)
(
-
2
,
2
2
)
(
6
,
3
)
Graph #2
Graph #3
Graph #4
Graph #5
Graph #6
The WINDOW needs to be large enough to see graph!
•
The
ZEROES/ ROOTS
of a polynomial function are
the
x
-intercepts of the graph
.
Input [ Y=] as Y
1
=
function and
Y
2
=
0
[2
nd
]
[Calc]
[Intersect
]
•
To find
EXTEREMA
(maximums and minimums):
Input [ Y=] as Y
1
=
function
[2
nd
]
[
Calc]
[3: Min] or [4: Max]
–
LEFT and RIGHT bound
tells the calculator where on the
domain to search for the min or max.
–
y
-value
of the point is the
min/max value.
CALCULATOR COMMANDS for
POLYNOMIAL FUNCTIONS
Using your calculator :
Graph the each polynomial
function and identify the ZEROES, EXTREMA, and
END BEHAVIOR.
[1]
[2]
[3]
[4]
Math 3 Hon: Unit 4
Explore the essential concepts of polynomials, including degrees, coefficients, and graph shapes. Learn to identify leading coefficients, degrees, and relationships between polynomial functions and their graphs. Practice finding values of polynomials and analyzing the impact of degrees on the number of roots and graph shapes.

Download Presentation

Please find below an Image/Link to download the presentation.
The content on the website is provided AS IS for your information and personal use only. It may not be sold, licensed, or shared on other websites without obtaining consent from the author.If you encounter any issues during the download, it is possible that the publisher has removed the file from their server.
You are allowed to download the files provided on this website for personal or commercial use, subject to the condition that they are used lawfully. All files are the property of their respective owners.
The content on the website is provided AS IS for your information and personal use only. It may not be sold, licensed, or shared on other websites without obtaining consent from the author.
E N D
Presentation Transcript
POLYNOMIALS REVIEW The DEGREE of a polynomial is the largest degree of any single term in the polynomial (Polynomials are often written in descending order of the degree of its terms) COEFFICIENTS are the numerical value of each term in the polynomial The LEADING COEFFICIENT is the numerical value of the term with the HIGHEST DEGREE.
Polynomials Review Practice For each polynomial 1) Write the polynomial in descending order 2) Identify the DEGREE and LEADING COEFFICIENT of the polynomial + + + + 7 5 9 3 x x x x x 11 8 2 15 5 + + + + + + 8 6 4 2 x x x x 7 9 6 1 + + + + 2 4 3 x x x x 3 4 5 2 7 + + + + 5 4 2 x x x x 4 6 3 11 5
Finding values of a polynomial: Substitute values of x into polynomial and simplify: 6 4 ) ( + + = = x x x f __________ ) 2 ( = = f + + 5 4 2 x x 3 11 5 = = + + ) 1 3 2 f x x x ( x ( ) 5 f 12 6 Find each value for 1. 2. ) 3 ( f 3. 4. 2 1 ( f ) 2 f a 3 ( )
Graphs of Polynomial Functions: Constant Function (degree = 0) Linear Function (degree = 1) Quadratic Function (degree = 2) Cubic Function (deg. = 3) Quartic Function (deg. = 4) Quintic Function (deg. = 5)
OBSERVATIONS of Polynomial Graphs: 1) How does the degree of a polynomial function relate the number of roots of the graph? 2) Is there any relationship between the degree of the polynomial function and the shape of the graph?
OBSERVATIONS of Polynomial Graphs: 3) What additional information (value) related the degree of the polynomial may affect the shape of its graph? Describe possible shape of the following based on the degree and leading coefficient: 5 3 2 ) ( + + + + = = x x x f = = + + + + 5 3 g x x x x ( ) 3 7 4 1 4 2
Degree Practice with Polynomial Functions Identify the degree as odd or even and state the assumed degree. Identify leading coefficient as positive or negative.
Draw a graph for each descriptions: Description #1: Degree = 4 Leading Coefficient = 2 Leading Coefficient = -3 Description #3: Degree = 3 Leading Coefficient = 1 Description #2: Degree = 6 Description #5: Degree = 5 Leading Coefficient = -4 Description #4: Degree = 8 Leading Coefficient = -2
Graphs # 1 6 Identify RANGE:Interval or Inequality Notation Graph #1 Graph #2 Graph #3 (-2, 8) (0, 11) (13, 9) (1, 4) (7, -2) (-17, -10) (-6, -9) (-5, -9) (4, -15) Graph #6 Graph #5 (-5,17) Graph #4 (-3,12) (6, 11) (1, 12) (-3, 3) (4, 8) (2, 2) (-2, 6) (3, 2) (1, -3) (-5, -4) (1, -9) (4, -5)
The END BEHAVIOR of a polynomial describes the RANGE, f(x), as the DOMAIN, x, moves LEFT(as x approaches negative infinity: x - ) and RIGHT(as x approaches positive infinity : x ) on the graph. Determine the end behavior for each of the given graphs x x Right: Right: x x Left: Left:
Use Graphs #1 6 from the previous Slide Describe the END BEHAVIOR of each graph Identify if the degree is EVEN or ODD for the graph Identify if the leading coefficient is POSITIVE or NEGATIVE GRAPH #2 GRAPH #3 GRAPH #1 ) ( , f x x _____ x f x , ( ) _____ Degree: EVEN or ODD Leading Coefficient: POS or NEG GRAPH #4 GRAPH #6 GRAPH #5
Describing Polynomial Graphs Based on the Equation Based on the given polynomial function: Identify the Leading Coefficient and Degree. Sketch possible graph (Hint: How many direction changes possible?) Identify the END BEHAVIOR x x x x f 3 6 2 ) ( + + = = = = + + + + 4 2 5 3 h x x x x ( ) 2 1 = = + + + + 3 2 = = + + + + + + 6 4 2 p x x x x x ( ) 2 3 3 g x x x x ( ) 2 3 4
EXTREMA: MAXIMUM and MINIMUM points are the highest and lowest points on the graph. Point A is a Relative Maximumbecause it is the highest point in the immediate area (not the highest point on the entire graph). C A Point B is a Relative Minimumbecause it is the lowest point in the immediate area (not the lowest point on the entire graph). Point C is the Absolute Maximum because it is the highest point on the entire graph. B There is no Absolute Minimumon this graph because the end behavior is: ) ( , x f x x f x , ( ) (there is no bottom point)
Identify ALL Maximum or Minimum Points Distinguish if each is RELATIVE (R) or ABSOLUTE (A) Graph #1 Graph #2 Graph #3 (-2, 8) (0, 11) (13, 9) (1, 4) (7, -2) (-6, -9) (-5, -9) (-17, -10) (4, -15) Graph #6 Graph #5 Graph #4 (-3,12) (6, 11) (-2, 22) (-3, 3) (2, 2) (6, 3) (1, -3) (1, -9) (-5, -4) (4, -5)
CALCULATOR COMMANDS for POLYNOMIAL FUNCTIONS The WINDOW needs to be large enough to see graph! The ZEROES/ ROOTS of a polynomial function are the x-intercepts of the graph. Input [ Y=] as Y1 = function and Y2 = 0 [2nd ] [Calc] [Intersect] To find EXTEREMA(maximums and minimums): Input [ Y=] as Y1 = function [2nd ] [Calc] [3: Min] or [4: Max] LEFT and RIGHT bound tells the calculator where on the domain to search for the min or max. y-value of the point is the min/max value.
Using your calculator : Graph the each polynomial function and identify the ZEROES, EXTREMA, and END BEHAVIOR. [1] 11 8 3 ) ( + + + + = = x x x x f = = + + + + 3 2 g x x x x ( ) 2 6 4 1 4 3 [2] 1 = = + + + + 5 3 2 = = + + + + 4 3 2 y x x x x 3 2 8 y x x x x 8 5 1 [3] [4] 2