Osteosarcoma Incidence and Mortality in Ohio, 2001-2020: Data Analysis
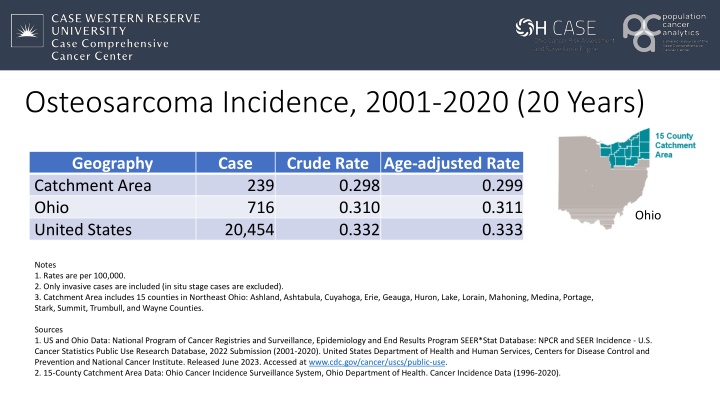
Examination of osteosarcoma incidence and mortality rates over two decades in Ohio's 15-county catchment area reveals a crude rate of 0.298-0.333 for incidence and 0.142-0.179 for mortality per 100,000. Data sources include SEER databases, highlighting the challenges in identifying osteosarcoma cases within reporting systems. Methods involving histology codes and AYA site criteria were utilized to extract relevant information on osteosarcoma cases.
Download Presentation

Please find below an Image/Link to download the presentation.
The content on the website is provided AS IS for your information and personal use only. It may not be sold, licensed, or shared on other websites without obtaining consent from the author.If you encounter any issues during the download, it is possible that the publisher has removed the file from their server.
You are allowed to download the files provided on this website for personal or commercial use, subject to the condition that they are used lawfully. All files are the property of their respective owners.
The content on the website is provided AS IS for your information and personal use only. It may not be sold, licensed, or shared on other websites without obtaining consent from the author.
E N D
Presentation Transcript
Osteosarcoma Incidence, 2001-2020 (20 Years) Geography Catchment Area Ohio United States Case Crude Rate Age-adjusted Rate 0.298 0.310 0.332 239 716 0.299 0.311 0.333 Ohio 20,454 Notes 1. Rates are per 100,000. 2. Only invasive cases are included (in situ stage cases are excluded). 3. Catchment Area includes 15 counties in Northeast Ohio: Ashland, Ashtabula, Cuyahoga, Erie, Geauga, Huron, Lake, Lorain, Mahoning, Medina, Portage, Stark, Summit, Trumbull, and Wayne Counties. Sources 1. US and Ohio Data: National Program of Cancer Registries and Surveillance, Epidemiology and End Results Program SEER*Stat Database: NPCR and SEER Incidence - U.S. Cancer Statistics Public Use Research Database, 2022 Submission (2001-2020). United States Department of Health and Human Services, Centers for Disease Control and Prevention and National Cancer Institute. Released June 2023. Accessed at www.cdc.gov/cancer/uscs/public-use. 2. 15-County Catchment Area Data: Ohio Cancer Incidence Surveillance System, Ohio Department of Health. Cancer Incidence Data (1996-2020).
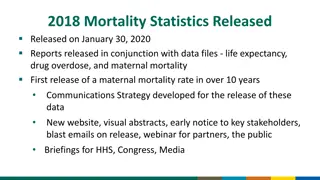
Osteosarcoma Mortality, 2011-2020 (10 Year) Geography Catchment Area Ohio US (20 SEER Regions) Case Crude Rate Age-adjusted Rate 0.151 0.153 0.179 60 178 2,397 0.142 0.146 0.175 Ohio Notes 1. Rates are per 100,000. 2. Only invasive cases are included (in situ stage cases are excluded). 3. Catchment Area includes 15 counties in Northeast Ohio: Ashland, Ashtabula, Cuyahoga, Erie, Geauga, Huron, Lake, Lorain, Mahoning, Medina, Portage, Stark, Summit, Trumbull, and Wayne Counties. 4. US (20 SEER Regions) includes San Francisco Oakland SMSA, Connecticut, Hawaii, Iowa, New Mexico, Seattle, Utah, Atlanta, Alaska Natives, San Jose Monterey, Los Angeles, Rural Georgia, California excluding SFSJMLA, Kentucky, Louisiana, New Jersey, Greater Georgia, Idaho, New York, and Texas. Sources 1. US and Ohio Data: Surveillance, Epidemiology, and End Results (SEER) Program (www.seer.cancer.gov) SEER*Stat Database: Incidence-Based Mortality - SEER Research Plus Limited-Field Data, 22 Registries (excl IL and MA), Nov 2022 Sub (2000-2020) - Linked To County Attributes - Total U.S., 1969-2021 Counties, National Cancer Institute, DCCPS, Surveillance Research Program, released April 2023, based on the November 2022 submission. 2. 15-County Catchment Area Data: Ohio Cancer Incidence Surveillance System, Ohio Department of Health. Cancer Incidence Data (1996-2020).
Methods to obtain rates of Osteosarcoma OCISS does not have a variable that can directly identify osteosarcoma. OCISS has Histology variable. SEER*STAT has a variable named AYA Site that can capture osteosarcoma SEER*STAT has state data but not county data for Ohio. Using the AYA Site = Osteosarcoma from SEER*STAT to identify histology codes that can be used in OCISS to identify Osteosarcoma. Cross check the previous step between SEER*STAT and OCISS for Ohio data.
Get histology codes based on AYA site in SEER*STAT: Osteosarcoma 1. Inclusion Criteria: AYA site = 4.1 Osteosarcoma 3. Results Histology code: 9180-9187, 9192-9194 Total cases: 20438 2. Display row: Histology
Check AYA sites based on histology codes in the previous slide 1. Inclusion Criteria: Histology codes in previous slide 3. Results: no other sites except for 4.1 Osteosarcoma Total cases: 20438 (Same as in previous page) 2. Display row: AYA site Next step: Use the histology codes to capture Osteosarcoma in OCISS
Can we use C codes to identify osteosarcoma? Probably not. This is a list of C codes based on AYA Site = Osteosarcoma
Compare Ohio Osteosarcoma cases between SEER*STAT and OCISS Years = 2001-2020 SEER*STAT AYA Site = Osteosarcoma OCISS Histology code: 9180-9187, 9192-9194 Crude rate Results Count: 715 Crude Rate: 0.310 Age-adjusted rate
Osteosarcoma in 15-County Catchment Area Results from OCISS using Histology codes 9180-9187, 9192-9194 Count: 239 Crude Rate: 0.298 Age-adjusted: 0.299 * Population data are from SEER website. The Age-adjusted rate is calculated using an algorithm written in R.
Osteosarcoma in US Crude Rate
