Operational Summary Report February 3, 2022
 undefined


February 3, 2022


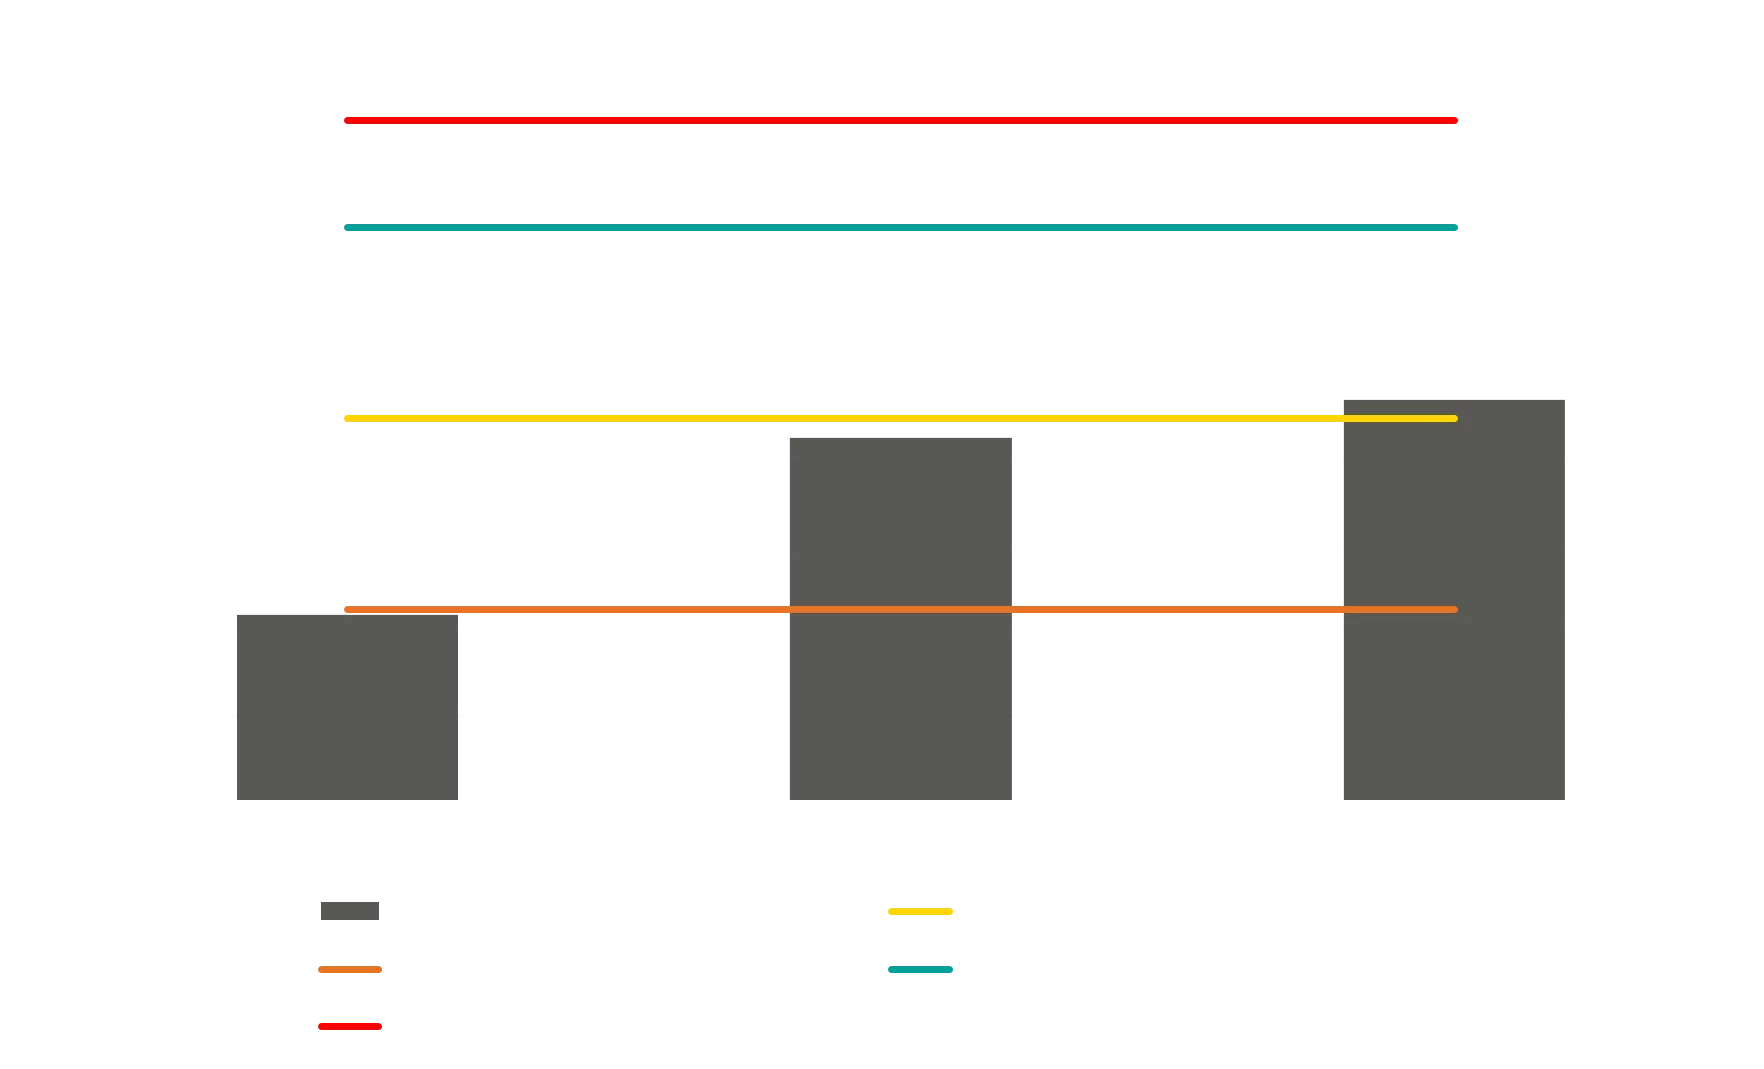
Local Service Passengers per
Revenue Hour (Weekdays)
2

Regional Service Passengers per
Revenue Hour (Weekdays)
3
On Demand Service Passengers per
Revenue Hour (Weekdays)
4
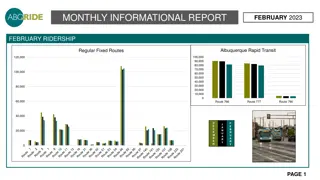
Total Ridership Change
5
Total Ridership Change
6
January 22 to February 20,
2022 Temporary Changes
Route 10 Monday-Saturday has been reduced
to Saturday Service.
No Sunday Service on the Yountville Trolley
No Service on the 11X has been temporarily
discontinued.
Two trips on the Route 29 BART Express will
not run.
Planned to resume on February 21, 2022
7
Oct to Dec
Vine Transit Maintenace Facility Public Workshop
In this operational summary report, data for the second quarter of FY 21/22 is presented, including passenger trends, local and regional service statistics, on-demand service details, total ridership changes, and temporary service adjustments from January 22 to February 20, 2022.

Download Presentation

Please find below an Image/Link to download the presentation.
The content on the website is provided AS IS for your information and personal use only. It may not be sold, licensed, or shared on other websites without obtaining consent from the author.If you encounter any issues during the download, it is possible that the publisher has removed the file from their server.
You are allowed to download the files provided on this website for personal or commercial use, subject to the condition that they are used lawfully. All files are the property of their respective owners.
The content on the website is provided AS IS for your information and personal use only. It may not be sold, licensed, or shared on other websites without obtaining consent from the author.
E N D
Presentation Transcript
FY 21/22 SECOND QUARTER FY 21/22 SECOND QUARTER OPERATIONAL SUMMARY OPERATIONAL SUMMARY REPORT REPORT February 3, 2022
Local Service Passengers per Local Service Passengers per Revenue Hour (Weekdays) Revenue Hour (Weekdays) 9 8 7 6 5 4 3 2 1 0 2nd Qtr FY20/21: On-Demand 1st Qtr FY21/22: Hybrid 2nd Qtr FY21/22: Hybrid Pasengers Per Revenue Hours 50% Service Mean Minimum Threshold 50% Mean 150% Service Mean 2
Regional Service Passengers per Regional Service Passengers per Revenue Hour (Weekdays) Revenue Hour (Weekdays) 14 12 10 8 6 4 2 0 Route 10 Route 11 Route 10X Route 11X Route 21 Route 29 Passengers per Revenue Hour 50% of Service Mean Minimum Threshold Service Mean 150% of Service Mean 3
On Demand Service Passengers per On Demand Service Passengers per Revenue Hour (Weekdays) Revenue Hour (Weekdays) 4.5 4.0 3.5 3.0 2.5 2.0 1.5 1.0 0.5 0.0 Calistoga Shuttle St. Helena Shuttle Yountville Trolley American Canyon Transit Passengers per Revenue Hour 50% of Service Mean Minimum Threshold Service Mean 150% of Service Mean 4
Total Ridership Change Total Ridership Change 100,000 80,000 60,000 40,000 20,000 0 Local/OD Route 10 Route 11 Route 10X Route 11X Route 21 Route 29 2nd Qtr FY 19/20 2nd Qtr FY 20/21 1st Qtr FY 21/22 2nd Qtr 21/22 5
Total Ridership Change Total Ridership Change 8,000 7,000 6,000 5,000 4,000 3,000 2,000 1,000 0 VineGo Calistoga Shuttle St. Helena Shuttle Yountville Trolley American Canyon Transit 2nd Qtr FY 19/20 2nd Qtr FY 20/21 1st Qtr FY 21/22 2nd Qtr 21/22 6
January 22 January 22 to February 20, to February 20, 2022 Temporary Changes 2022 Temporary Changes Route 10 Monday-Saturday has been reduced to Saturday Service. No Sunday Service on the Yountville Trolley No Service on the 11X has been temporarily discontinued. Two trips on the Route 29 BART Express will not run. Planned to resume on February 21, 2022 7