Semi-Annual Financial Report S2 - 2022 Summary


GS/OAS/SAF/DFS – March 2023

Key financial data
S2 - 2022


Key financial data
Information on Regular Fund quotas as of December 31, 2022
S2 - 2022
Key financial data
Quota Compliance: Member States with balances due as of December 31, 2022
S2 - 2022
Key financial data
Quota Compliance: Member States with balances due as of March 17, 2023
S2 - 2022
Key financial data
S2 - 2022
Regular Fund liquidity risk assessment as of December 31, 2022
Key financial data
R
e
g
u
l
a
r
F
u
n
d
L
i
q
u
i
d
i
t
y
f
r
o
m
J
a
n
u
a
r
y
t
o
D
e
c
e
m
b
e
r
2
0
2
2
(
i
n
m
i
l
l
i
o
n
s
o
f
U
S
D
)
S2 - 2022
Key financial data
S2 - 2022
Key financial data
S2 - 2022
Specific Funds and ICR collection
S2 - 2022
Specific Funds and ICR collection
S2 - 2022
T
r
e
n
d
o
f
C
o
n
t
r
i
b
u
t
i
o
n
s
t
o
S
p
e
c
i
f
i
c
F
u
n
d
s
a
n
d
I
C
R
C
o
l
l
e
c
t
i
o
n
(
i
n
m
i
l
l
i
o
n
s
o
f
U
S
D
)
Regular Fund
S2 - 2022
R
e
g
u
l
a
r
F
u
n
d
.
A
s
o
f
D
e
c
e
m
b
e
r
3
1
(
I
n
m
i
l
l
i
o
n
s
o
f
U
S
D
)
ICR Fund
S2 - 2022
ICR Fund
. As of December 31
(In millions of USD)
Summary - Key Points
S2 - 2022
T
h
e
2
0
2
2
R
e
g
u
l
a
r
F
u
n
d
e
x
e
c
u
t
i
o
n
w
a
s
9
9
.
3
%
o
f
t
h
e
a
p
p
r
o
v
e
d
b
u
d
g
e
t
.
Q
u
o
t
a
s
i
n
a
r
r
e
a
r
s
i
n
c
r
e
a
s
e
d
f
r
o
m
U
S
D
1
9
.
4
m
i
l
l
i
o
n
a
t
t
h
e
e
n
d
o
f
2
0
2
1
t
o
U
S
D
2
6
.
3
m
i
l
l
i
o
n
a
t
t
h
e
e
n
d
o
f
2
0
2
2
.
A
t
t
h
e
e
n
d
o
f
2
0
2
2
,
t
w
e
n
t
y
-
t
h
r
e
e
M
e
m
b
e
r
S
t
a
t
e
s
h
a
d
p
a
i
d
i
n
f
u
l
l
t
h
e
i
r
q
u
o
t
a
a
s
s
e
s
s
m
e
n
t
s
i
n
c
l
u
d
i
n
g
a
r
r
e
a
r
s
.
E
l
e
v
e
n
M
e
m
b
e
r
S
t
a
t
e
s
a
r
e
c
o
n
s
i
d
e
r
e
d
n
o
t
c
u
r
r
e
n
t
w
i
t
h
f
o
u
r
o
f
t
h
e
m
a
l
s
o
h
a
v
i
n
g
a
r
r
e
a
r
s
f
r
o
m
p
r
i
o
r
y
e
a
r
s
.
T
h
e
o
u
t
s
t
a
n
d
i
n
g
q
u
o
t
a
b
a
l
a
n
c
e
i
s
U
S
D
4
3
.
6
m
i
l
l
i
o
n
,
i
n
c
l
u
d
i
n
g
t
h
e
U
S
D
2
6
.
3
m
i
l
l
i
o
n
f
r
o
m
p
r
i
o
r
y
e
a
r
s
a
r
r
e
a
r
s
.
R
e
g
u
l
a
r
F
u
n
d
m
o
n
t
h
l
y
c
a
s
h
f
l
o
w
d
e
f
i
c
i
t
s
d
u
r
i
n
g
2
0
2
2
w
e
r
e
c
o
v
e
r
e
d
t
h
r
o
u
g
h
t
e
m
p
o
r
a
r
y
l
o
a
n
s
f
r
o
m
t
h
e
O
A
S
T
r
e
a
s
u
r
y
F
u
n
d
.
A
t
t
h
e
e
n
d
o
f
2
0
2
2
,
t
h
e
r
e
w
a
s
a
n
o
u
t
s
t
a
n
d
i
n
g
b
a
l
a
n
c
e
o
n
t
h
i
s
l
o
a
n
o
f
U
S
D
2
.
7
m
i
l
l
i
o
n
.
C
o
n
t
r
i
b
u
t
i
o
n
s
t
o
S
p
e
c
i
f
i
c
F
u
n
d
s
a
m
o
u
n
t
e
d
t
o
U
S
D
5
9
.
8
m
i
l
l
i
o
n
,
4
.
1
%
h
i
g
h
e
r
t
h
a
n
2
0
2
1
.
I
C
R
c
o
l
l
e
c
t
i
o
n
i
n
2
0
2
2
,
t
o
t
a
l
e
d
U
S
D
7
.
1
m
i
l
l
i
o
n
,
5
.
5
%
l
o
w
e
r
t
h
a
n
2
0
2
1
.
This report provides key financial data for the second half of 2022, including budgetary execution, fund quotas compliance, member states' balances due, liquidity risk assessment, and more. It outlines the overall program budget execution, quota compliance of member states, and fund liquidity status. The report depicts a detailed financial snapshot as of December 31, 2022, reflecting quota payments received, balances due, cash and loan balances, and other relevant financial metrics.

Download Presentation

Please find below an Image/Link to download the presentation.
The content on the website is provided AS IS for your information and personal use only. It may not be sold, licensed, or shared on other websites without obtaining consent from the author.If you encounter any issues during the download, it is possible that the publisher has removed the file from their server.
You are allowed to download the files provided on this website for personal or commercial use, subject to the condition that they are used lawfully. All files are the property of their respective owners.
The content on the website is provided AS IS for your information and personal use only. It may not be sold, licensed, or shared on other websites without obtaining consent from the author.
E N D
Presentation Transcript
Semi-Annual Financial Report (SFR) S2 - 2022 (as of December 31, 2022) GS/OAS/SAF/DFS March 2023
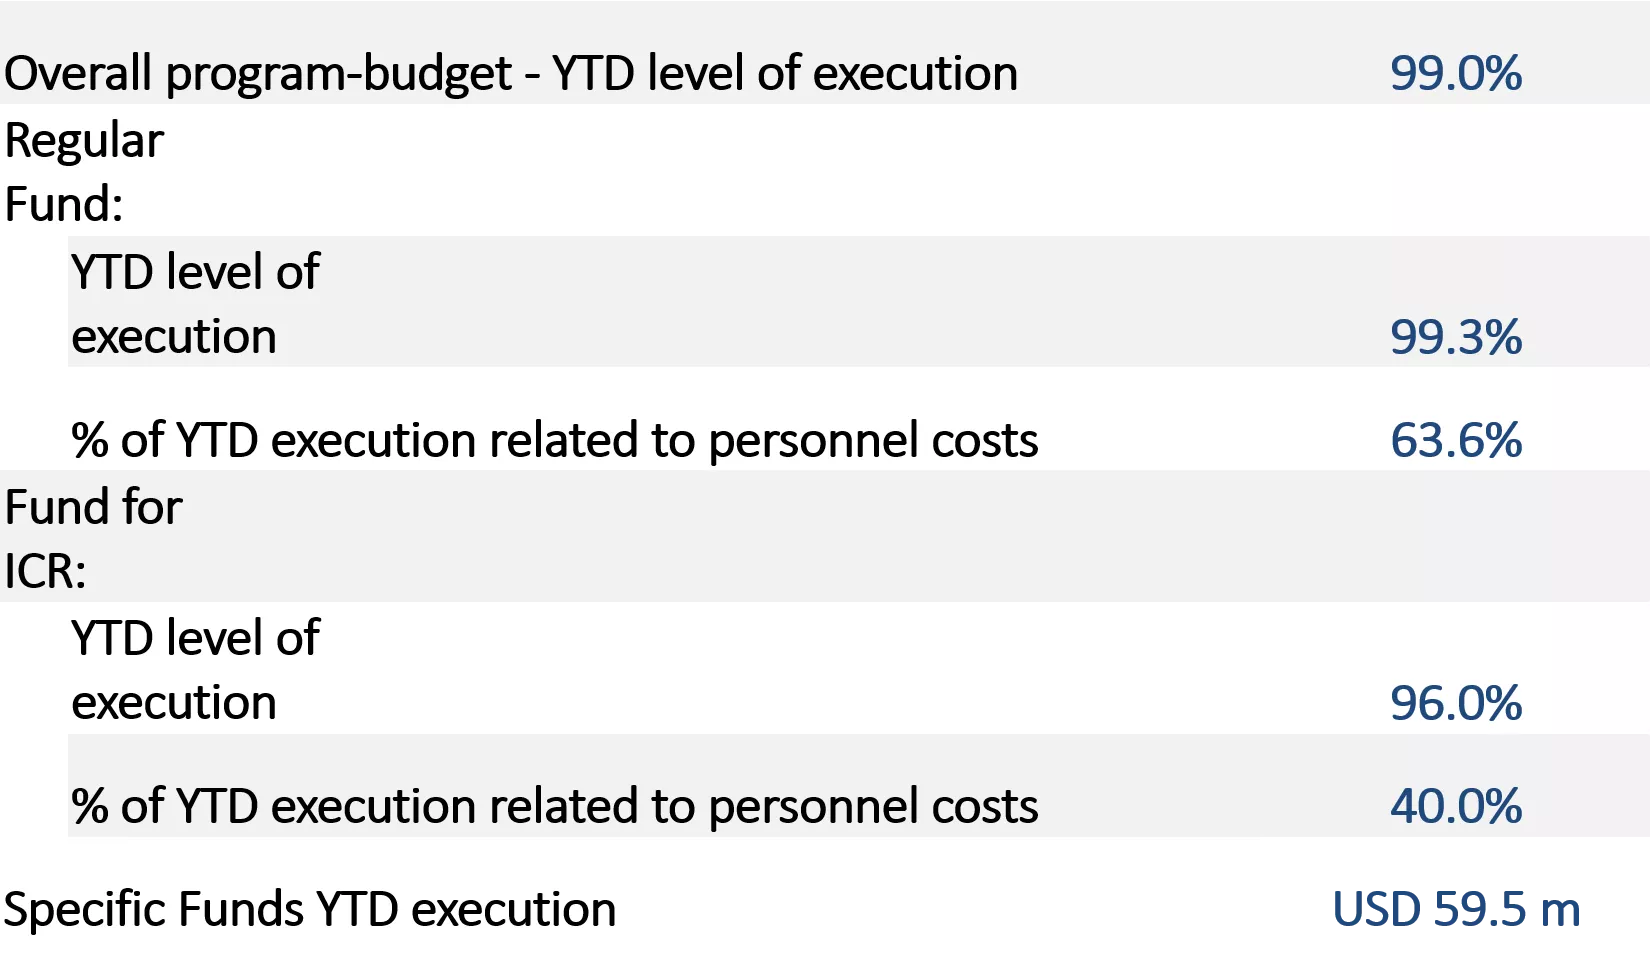
Key financial data S2 - 2022 Budgetary execution as of December 31, 2022 Overall program Overall program- -budget Regular Regular Fund: Fund: YTD level of YTD level of execution execution budget - - YTD level of execution YTD level of execution 99.0% 99.0% 99.3% 99.3% % of YTD execution related to personnel costs % of YTD execution related to personnel costs Fund for Fund for ICR: ICR: YTD level of YTD level of execution execution 63.6% 63.6% 96.0% 96.0% % of YTD execution related to personnel costs % of YTD execution related to personnel costs 40.0% 40.0% Specific Funds YTD execution Specific Funds YTD execution USD 59.5 m USD 59.5 m
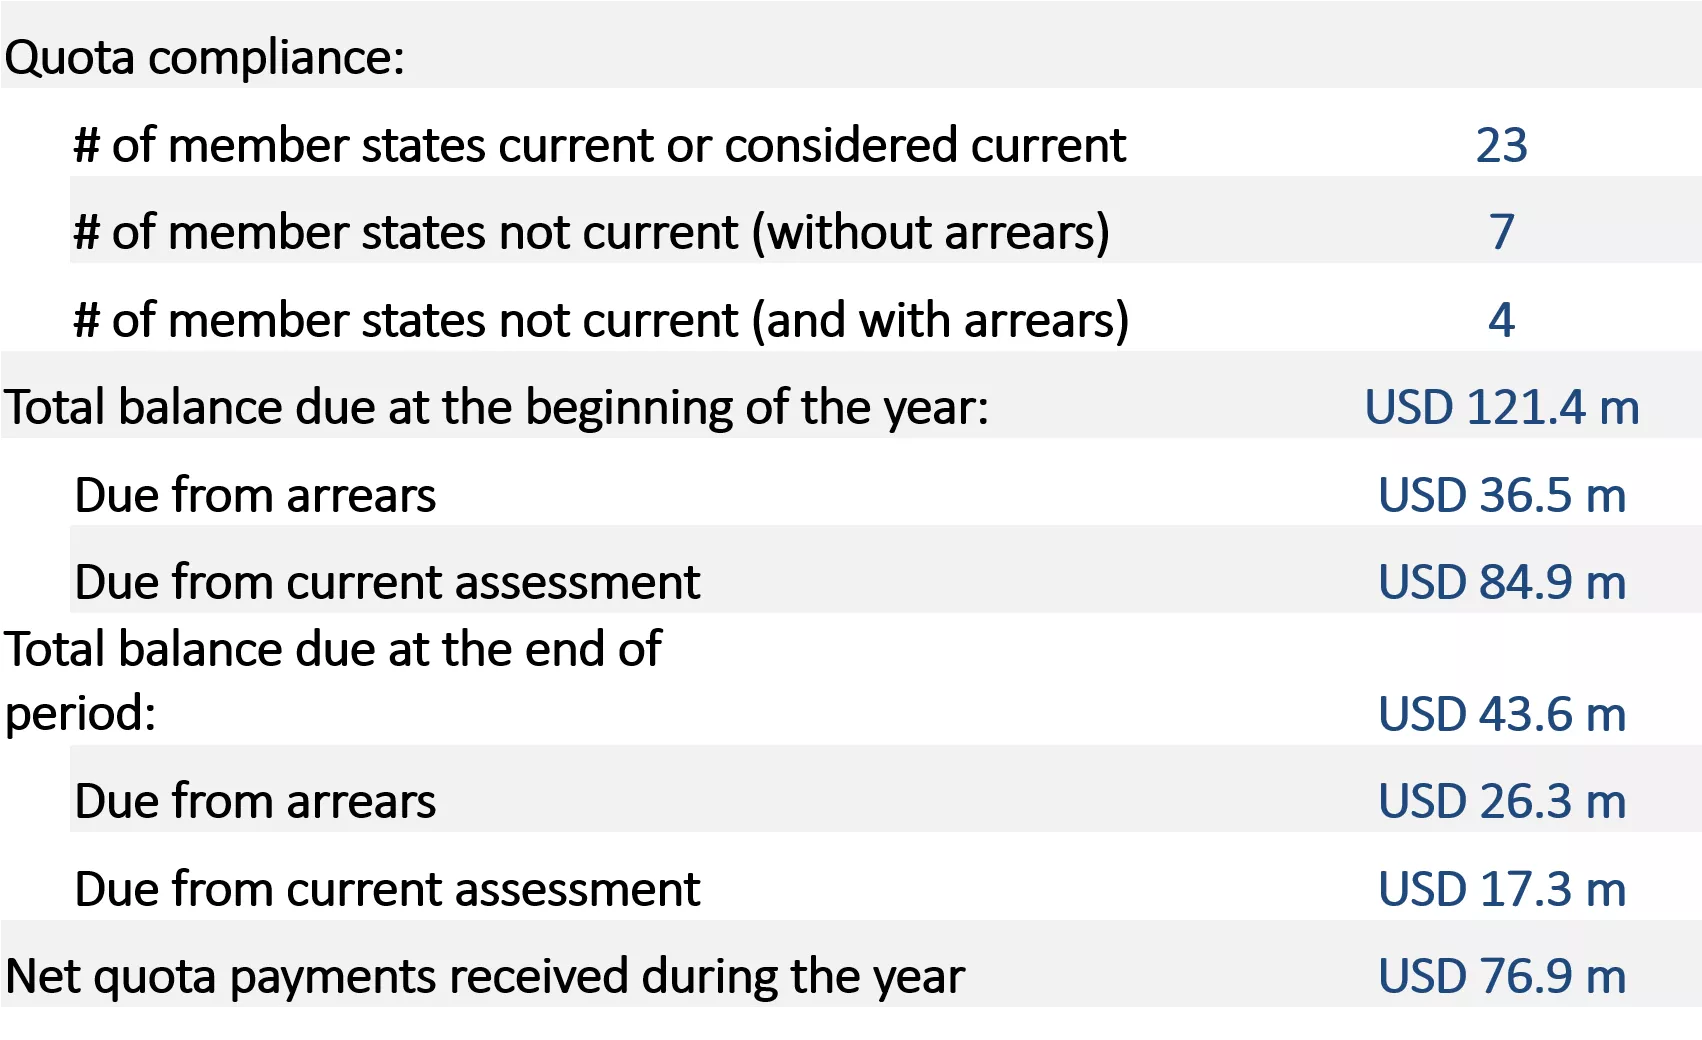
Key financial data S2 - 2022 Information on Regular Fund quotas as of December 31, 2022 Quota compliance: Quota compliance: # of member states current or considered current # of member states current or considered current 23 23 # of member states not current (without arrears) # of member states not current (without arrears) 7 7 # of member states not current (and with arrears) # of member states not current (and with arrears) 4 4 Total balance due at the beginning of the year: Total balance due at the beginning of the year: USD 121.4 m USD 121.4 m Due from arrears Due from arrears USD 36.5 m USD 36.5 m Due from current assessment Due from current assessment Total balance due at the end of Total balance due at the end of period: period: USD 84.9 m USD 84.9 m USD 43.6 m USD 43.6 m Due from arrears Due from arrears USD 26.3 m USD 26.3 m Due from current assessment Due from current assessment USD 17.3 m USD 17.3 m Net quota payments received during the year Net quota payments received during the year USD 76.9 m USD 76.9 m
Key financial data S2 - 2022 Quota Compliance: Member States with balances due as of December 31, 2022
Key financial data S2 - 2022 Quota Compliance: Member States with balances due as of March 17, 2023
Key financial data S2 - 2022 Regular Fund liquidity risk assessment as of December 31, 2022 Cash balance at the beginning of the year (2022) Cash balance at the beginning of the year (2022) USD 1.3 m USD 1.3 m Cash balance at the end of Cash balance at the end of period period USD 0.0 m USD 0.0 m Loan balance to Treasury Fund at the end of period Loan balance to Treasury Fund at the end of period USD 2.7 m USD 2.7 m
Key financial data S2 - 2022 Regular Fund Liquidity from January to December 2022 Regular Fund Liquidity from January to December 2022 (in millions of USD) (in millions of USD) 25 20 15 13.8 12.0 10.6 10 8.6 6.7 4.9 4.8 5 3.2 0 Jan Feb Mar Apr May Jun Jul Aug Sep Oct Nov Dec (1.0) (2.7) (3.0) (3.1) -5 Cash balance at the end of period Inflows Outflows
Key financial data S2 - 2022 Specific Funds: Contributions by Chapter (with comparison to prior year) (In thousands of USD)
Key financial data S2 - 2022 Specific Funds YTD overall contributions received from donors YTD overall contributions received from donors USD 59.8 m USD 59.8 m YTD contributions YTD contributions - - % change over same period last year % change over same period last year 4.1% 4.1% YTD contributions YTD contributions - - % change over same period last year by donor: % change over same period last year by donor: Member states Member states 9.0% 9.0% Permanent Permanent observers observers - -9.9% 9.9% Institutions and other donors Institutions and other donors 6.9% 6.9% YTD ICR collection on Specific Funds YTD ICR collection on Specific Funds - - % change over same period last year % change over same period last year - -5.5% 5.5% Amount of new donor agreements starting execution this year Amount of new donor agreements starting execution this year USD 25.7 m USD 25.7 m Programmatic pillar with largest amount of YTD expenditures Programmatic pillar with largest amount of YTD expenditures Multidimen Multidimen. Security . Security
Specific Funds and ICR collection S2 - 2022 Specific Funds: Main donors contribution (In thousands of USD)
Specific Funds and ICR collection S2 - 2022 Trend of Contributions to Specific Funds and ICR Collection Trend of Contributions to Specific Funds and ICR Collection (in millions of USD) (in millions of USD) 61.3 59.8 59.3 57.8 57.7 57.4 51.1 45.8 41.4 8.2 7.5 7.1 7.0 6.6 6.0 5.9 5.9 4.4 2014 2015 2016 2017 2018 2019 2020 2021 2022 Contributions to Specific Funds ICR Collection
Regular Fund S2 - 2022 Regular Fund. As of December 31 (In millions of USD) 2017 2017 2018 2018 2019 2019 2020 2020 2021 2021 2022 2022 Income: Income: Net Quotas Net Quotas Interest and other income Interest and other income Total income Total income $87.4 $87.4 $0.5 $0.5 $87.9 $87.9 $84.8 $84.8 $0.5 $0.5 $85.3 $85.3 $64.5 $64.5 $0.6 $0.6 $65.1 $65.1 $75.9 $75.9 $0.5 $0.5 $76.4 $76.4 $88.8 $88.8 $0.5 $0.5 $89.3 $89.3 $77.3 $77.3 $0.5 $0.5 $77.8 $77.8 Less: Less: Budgetary execution Budgetary execution FONDEM and other outflows FONDEM and other outflows Total uses of Regular Fund Total uses of Regular Fund $73.4 $73.4 $1.6 $1.6 $75.0 $75.0 $79.8 $79.8 $0.2 $0.2 $80.0 $80.0 $81.6 $81.6 $0.0 $0.0 $81.6 $81.6 $82.3 $82.3 $0.1 $0.1 $82.4 $82.4 $76.4 $76.4 $0.1 $0.1 $76.5 $76.5 $80.4 $80.4 $0.5 $0.5 $80.9 $80.9 Operating surplus / (deficit) Operating surplus / (deficit) Add: reserve subfund at the beg.of year Add: reserve subfund at the beg.of year $12.9 $12.9 -$11.2 -$11.2 $5.3 $5.3 $1.7 $1.7 -$16.5 -$16.5 $7.1 $7.1 -$6.0 -$6.0 -$9.5 -$9.5 $12.9 $12.9 -$15.5 -$15.5 -$3.1 -$3.1 -$2.7 -$2.7 Fund balance at year-end Fund balance at year-end (1) (1) $1.7 $1.7 $7.1 $7.1 -$9.5 -$9.5 -$15.5 -$15.5 -$2.7 -$2.7 -$5.8 -$5.8 Quotas receivable Quotas receivable $12.0 $12.0 $11.7 $11.7 $32.0 $32.0 $40.7 $40.7 $36.5 $36.5 $43.6 $43.6 (1) Totals may differ slightly to exact amounts due to rounding (1) Totals may differ slightly to exact amounts due to rounding
ICR Fund S2 - 2022 ICR Fund. As of December 31 (In millions of USD) 2017 2017 2018 2018 2019 2019 2020 2020 2021 2021 2022 2022 ICR Income: ICR Income: ICR collection ICR collection Interest and other income Interest and other income Total ICR income Total ICR income $7.0 $7.0 $0.5 $0.5 $7.5 $7.5 $6.0 $6.0 $1.1 $1.1 $7.1 $7.1 $8.2 $8.2 $1.3 $1.3 $9.5 $9.5 $6.6 $6.6 $0.8 $0.8 $7.4 $7.4 $7.5 $7.5 $0.2 $0.2 $7.7 $7.7 $7.1 $7.1 $0.4 $0.4 $7.5 $7.5 (4) (4) Less: Less: Budgetary execution Budgetary execution Transfer to the Regular Fund & other outflows Transfer to the Regular Fund & other outflows Total uses of ICR Total uses of ICR $4.2 $4.2 $0.1 $0.1 $4.3 $4.3 $4.3 $4.3 $5.2 $5.2 $9.5 $9.5 $5.4 $5.4 $0.5 $0.5 $5.9 $5.9 $6.0 $6.0 $1.7 $1.7 $7.7 $7.7 $6.7 $6.7 $1.8 $1.8 $8.5 $8.5 $6.8 $6.8 $1.1 $1.1 $7.9 $7.9 (2) (2) (3) (3) (2) (2) (5) (5) (5) (5) Operating surplus / (deficit) Operating surplus / (deficit) Add: ICR reserve subfund at the beg. of year Add: ICR reserve subfund at the beg. of year $3.2 $3.2 $2.5 $2.5 -$2.4 -$2.4 $5.7 $5.7 $3.6 $3.6 $3.3 $3.3 -$0.3 -$0.3 $6.9 $6.9 -$0.8 -$0.8 $6.6 $6.6 -$0.4 -$0.4 $5.8 $5.8 Fund balance at year-end Fund balance at year-end (1) (1) $5.7 $5.7 $3.3 $3.3 $6.9 $6.9 $6.6 $6.6 $5.8 $5.8 $5.4 $5.4 (1) Totals may differ slightly to exact amounts due to rounding (1) Totals may differ slightly to exact amounts due to rounding (2) Approval for new ERP (2) Approval for new ERP (3) Approval to supplement the appropriations for Chapter 12 of the program-budget of the Regular Fund (3) Approval to supplement the appropriations for Chapter 12 of the program-budget of the Regular Fund (4) Interest income has been credited through September 30, 2022. (4) Interest income has been credited through September 30, 2022. (5) Approval to supplement the appropriations for various programs as per CP/RES. 1178/21 (5) Approval to supplement the appropriations for various programs as per CP/RES. 1178/21
Summary - Key Points S2 - 2022 The 2022 Regular Fund execution was 99.3% of the approved budget. Quotas in arrears increased from USD 19.4 million at the end of 2021 to USD 26.3 million at the end of 2022. At the end of 2022, twenty-three Member States had paid in full their quota assessments including arrears. Eleven Member States are considered not current with four of them also having arrears from prior years. The outstanding quota balance is USD 43.6 million, including the USD 26.3 million from prior years arrears. Regular Fund monthly cash flow deficits during 2022 were covered through temporary loans from the OAS Treasury Fund. At the end of 2022, there was an outstanding balance on this loan of USD 2.7 million. Contributions to Specific Funds amounted to USD 59.8 million, 4.1% higher than 2021. ICR collection in 2022, totaled USD 7.1 million, 5.5 % lower than 2021.