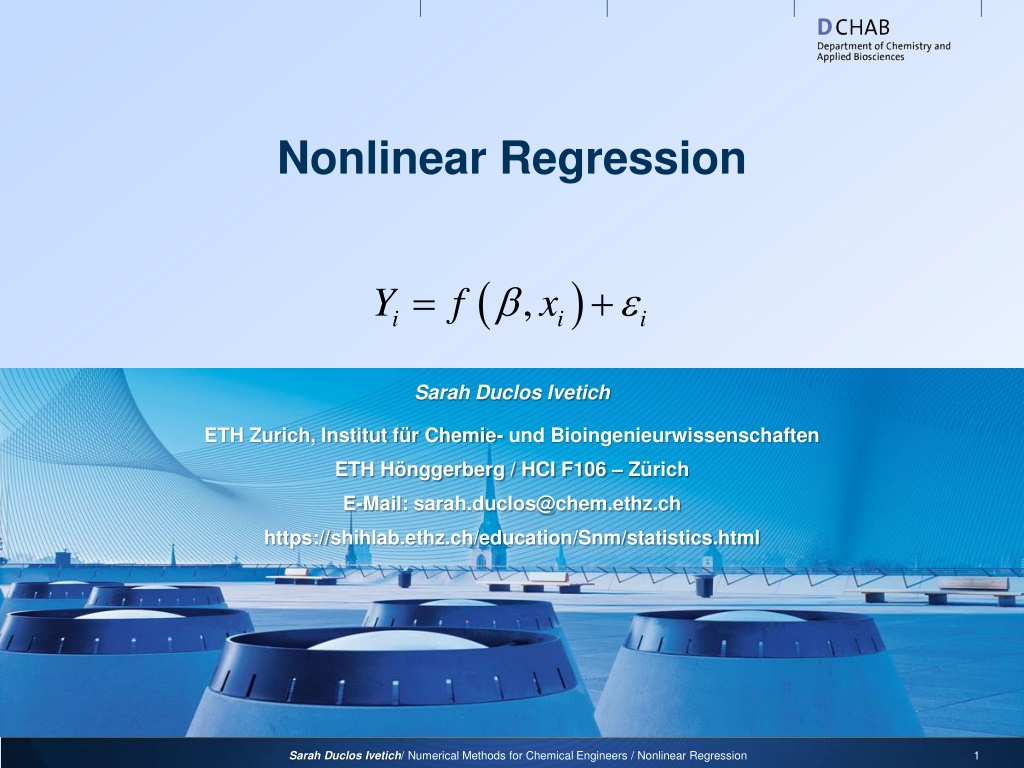
Nonlinear Regression in Chemical Kinetics Analysis
N
o
n
l
i
n
e
a
r
R
e
g
r
e
s
s
i
o
n
1
S
S
a
a
r
r
a
a
h
h
D
D
u
u
c
c
l
l
o
o
s
s
I
I
v
v
e
e
t
t
i
i
c
c
h
h
/
N
u
m
e
r
i
c
a
l
M
e
t
h
o
d
s
f
o
r
C
h
e
m
i
c
a
l
E
n
g
i
n
e
e
r
s
/
N
o
n
l
i
n
e
a
r
R
e
g
r
e
s
s
i
o
n
S
S
a
a
r
r
a
a
h
h
D
D
u
u
c
c
l
l
o
o
s
s
I
I
v
v
e
e
t
t
i
i
c
c
h
h
E
E
T
T
H
H
Z
Z
u
u
r
r
i
i
c
c
h
h
,
,
I
I
n
n
s
s
t
t
i
i
t
t
u
u
t
t
f
f
ü
ü
r
r
C
C
h
h
e
e
m
m
i
i
e
e
-
-
u
u
n
n
d
d
B
B
i
i
o
o
i
i
n
n
g
g
e
e
n
n
i
i
e
e
u
u
r
r
w
w
i
i
s
s
s
s
e
e
n
n
s
s
c
c
h
h
a
a
f
f
t
t
e
e
n
n
E
E
T
T
H
H
H
H
ö
ö
n
n
g
g
g
g
e
e
r
r
b
b
e
e
r
r
g
g
/
/
H
H
C
C
I
I
F
F
1
1
0
0
6
6
–
–
Z
Z
ü
ü
r
r
i
i
c
c
h
h
E
E
-
-
M
M
a
a
i
i
l
l
:
:
s
s
a
a
r
r
a
a
h
h
.
.
d
d
u
u
c
c
l
l
o
o
s
s
@
@
c
c
h
h
e
e
m
m
.
.
e
e
t
t
h
h
z
z
.
.
c
c
h
h
h
h
t
t
t
t
p
p
s
s
:
:
/
/
/
/
s
s
h
h
i
i
h
h
l
l
a
a
b
b
.
.
e
e
t
t
h
h
z
z
.
.
c
c
h
h
/
/
e
e
d
d
u
u
c
c
a
a
t
t
i
i
o
o
n
n
/
/
S
S
n
n
m
m
/
/
s
s
t
t
a
a
t
t
i
i
s
s
t
t
i
i
c
c
s
s
.
.
h
h
t
t
m
m
l
l
E
x
a
m
p
l
e
:
P
u
r
o
m
y
c
i
n
Puromycin is an antibiotic used in
bio-research to select cells modified
by genetic engineering
T
h
e
M
i
c
h
a
e
l
i
s
-
M
e
n
t
e
n
m
o
d
e
l
f
o
r
e
n
z
y
m
e
k
i
n
e
t
i
c
s
r
e
l
a
t
e
s
t
h
e
i
n
i
t
i
a
l
v
e
l
o
c
i
t
y
o
f
a
n
e
n
z
y
m
a
t
i
c
r
e
a
c
t
i
o
n
t
o
t
h
e
s
u
b
s
t
r
a
t
e
c
o
n
c
e
n
t
r
a
t
i
o
n
x
b
y
t
h
e
e
q
u
a
t
i
o
n
At high concentrations, the velocity
is essentially constant (θ
1
), while at
low concentrations it is a linear
function of the concentration
2
S
S
a
a
r
r
a
a
h
h
D
D
u
u
c
c
l
l
o
o
s
s
I
I
v
v
e
e
t
t
i
i
c
c
h
h
/
N
u
m
e
r
i
c
a
l
M
e
t
h
o
d
s
f
o
r
C
h
e
m
i
c
a
l
E
n
g
i
n
e
e
r
s
/
N
o
n
l
i
n
e
a
r
R
e
g
r
e
s
s
i
o
n
P
u
r
o
m
y
c
i
n
K
i
n
e
t
i
c
s
3
S
S
a
a
r
r
a
a
h
h
D
D
u
u
c
c
l
l
o
o
s
s
I
I
v
v
e
e
t
t
i
i
c
c
h
h
/
N
u
m
e
r
i
c
a
l
M
e
t
h
o
d
s
f
o
r
C
h
e
m
i
c
a
l
E
n
g
i
n
e
e
r
s
/
N
o
n
l
i
n
e
a
r
R
e
g
r
e
s
s
i
o
n
M
o
d
e
l
L
i
n
e
a
r
i
z
a
t
i
o
n
The initial model reads
This can be rearranged to
Renaming the variables yields a linear model
4
S
S
a
a
r
r
a
a
h
h
D
D
u
u
c
c
l
l
o
o
s
s
I
I
v
v
e
e
t
t
i
i
c
c
h
h
/
N
u
m
e
r
i
c
a
l
M
e
t
h
o
d
s
f
o
r
C
h
e
m
i
c
a
l
E
n
g
i
n
e
e
r
s
/
N
o
n
l
i
n
e
a
r
R
e
g
r
e
s
s
i
o
n
L
i
n
e
a
r
i
z
e
d
M
o
d
e
l
:
F
i
t
5
S
S
a
a
r
r
a
a
h
h
D
D
u
u
c
c
l
l
o
o
s
s
I
I
v
v
e
e
t
t
i
i
c
c
h
h
/
N
u
m
e
r
i
c
a
l
M
e
t
h
o
d
s
f
o
r
C
h
e
m
i
c
a
l
E
n
g
i
n
e
e
r
s
/
N
o
n
l
i
n
e
a
r
R
e
g
r
e
s
s
i
o
n
R
e
g
r
e
s
s
i
o
n
f
r
o
m
L
i
n
e
a
r
i
z
e
d
M
o
d
e
l
6
S
S
a
a
r
r
a
a
h
h
D
D
u
u
c
c
l
l
o
o
s
s
I
I
v
v
e
e
t
t
i
i
c
c
h
h
/
N
u
m
e
r
i
c
a
l
M
e
t
h
o
d
s
f
o
r
C
h
e
m
i
c
a
l
E
n
g
i
n
e
e
r
s
/
N
o
n
l
i
n
e
a
r
R
e
g
r
e
s
s
i
o
n
Regression from linearized model
1
= 195.8
2
= 0.048407
N
o
n
l
i
n
e
a
r
R
e
g
r
e
s
s
i
o
n
T
h
e
o
b
j
e
c
t
i
v
e
f
u
n
c
t
i
o
n
o
f
n
o
n
-
l
i
n
e
a
r
r
e
g
r
e
s
s
i
o
n
r
e
a
d
s
w
h
e
r
e
y
i
s
t
h
e
v
e
c
t
o
r
o
f
r
e
s
p
o
n
s
e
s
,
x
i
s
t
h
e
v
e
c
t
o
r
o
f
o
b
s
e
r
v
a
t
i
o
n
s
,
θ
i
s
t
h
e
v
e
c
t
o
r
o
f
p
a
r
a
m
e
t
e
r
s
a
n
d
f
i
s
t
h
e
n
o
n
l
i
n
e
a
r
m
o
d
e
l
f
u
n
c
t
i
o
n
In the 2-parameter case, we can plot S(θ) as a function of
the parameter values to look for a minimum
7
S
S
a
a
r
r
a
a
h
h
D
D
u
u
c
c
l
l
o
o
s
s
I
I
v
v
e
e
t
t
i
i
c
c
h
h
/
N
u
m
e
r
i
c
a
l
M
e
t
h
o
d
s
f
o
r
C
h
e
m
i
c
a
l
E
n
g
i
n
e
e
r
s
/
N
o
n
l
i
n
e
a
r
R
e
g
r
e
s
s
i
o
n
O
b
j
e
c
t
i
v
e
F
u
n
c
t
i
o
n
S
(
θ
)
8
S
S
a
a
r
r
a
a
h
h
D
D
u
u
c
c
l
l
o
o
s
s
I
I
v
v
e
e
t
t
i
i
c
c
h
h
/
N
u
m
e
r
i
c
a
l
M
e
t
h
o
d
s
f
o
r
C
h
e
m
i
c
a
l
E
n
g
i
n
e
e
r
s
/
N
o
n
l
i
n
e
a
r
R
e
g
r
e
s
s
i
o
n
M
i
n
i
m
i
z
a
t
i
o
n
o
f
S
(
θ
)
I
f
w
e
l
i
n
e
a
r
i
z
e
t
h
e
m
o
d
e
l
w
i
t
h
r
e
s
p
e
c
t
t
o
t
h
e
p
a
r
a
m
e
t
e
r
s
,
w
e
g
e
t
w
h
e
r
e
J
(
θ
0
)
i
s
t
h
e
J
a
c
o
b
i
a
n
m
a
t
r
i
x
o
f
f
w
i
t
h
r
e
s
p
e
c
t
t
o
θ
,
e
v
a
l
u
a
t
e
d
a
t
θ
0
In this case, the residuals are
If we now define the objective function in terms of the
residuals, we can apply the Gauss-Newton method
9
S
S
a
a
r
r
a
a
h
h
D
D
u
u
c
c
l
l
o
o
s
s
I
I
v
v
e
e
t
t
i
i
c
c
h
h
/
N
u
m
e
r
i
c
a
l
M
e
t
h
o
d
s
f
o
r
C
h
e
m
i
c
a
l
E
n
g
i
n
e
e
r
s
/
N
o
n
l
i
n
e
a
r
R
e
g
r
e
s
s
i
o
n
Analogy:
G
a
u
s
s
-
N
e
w
t
o
n
M
e
t
h
o
d
a
p
p
l
i
e
d
t
o
S
(
θ
)
10
S
S
a
a
r
r
a
a
h
h
D
D
u
u
c
c
l
l
o
o
s
s
I
I
v
v
e
e
t
t
i
i
c
c
h
h
/
N
u
m
e
r
i
c
a
l
M
e
t
h
o
d
s
f
o
r
C
h
e
m
i
c
a
l
E
n
g
i
n
e
e
r
s
/
N
o
n
l
i
n
e
a
r
R
e
g
r
e
s
s
i
o
n
Convergence path of Gauss-
Newton Method
(
1
)
opt
= 212.66
(
2
)
opt
= 0.064091
N
o
n
l
i
n
e
a
r
R
e
g
r
e
s
s
i
o
n
11
S
S
a
a
r
r
a
a
h
h
D
D
u
u
c
c
l
l
o
o
s
s
I
I
v
v
e
e
t
t
i
i
c
c
h
h
/
N
u
m
e
r
i
c
a
l
M
e
t
h
o
d
s
f
o
r
C
h
e
m
i
c
a
l
E
n
g
i
n
e
e
r
s
/
N
o
n
l
i
n
e
a
r
R
e
g
r
e
s
s
i
o
n
Nonlinear Regression
Regression from linearized model
M
a
t
l
a
b
N
o
n
l
i
n
e
a
r
R
e
g
r
e
s
s
i
o
n
R
o
u
t
i
n
e
s
There are several options for doing nonlinear regression:
lsqcurvefit
lsqcurvefit
: Best for quickly fitting models to data; Not much
statistical output; Provides more numerical information and options;
Can use bounded parameter ranges
nlinfit
nlinfit
: General nonlinear regression routine; Provides some
statistical output
NonLinearModel
NonLinearModel
: Most useful for nonlinear regression; All
statistical and numerical tools in one place; Works analogously to
LinearModel
fitnlm
fitnlm
: new version of NonLinearModel (since 2013b)
12
S
S
a
a
r
r
a
a
h
h
D
D
u
u
c
c
l
l
o
o
s
s
I
I
v
v
e
e
t
t
i
i
c
c
h
h
/
N
u
m
e
r
i
c
a
l
M
e
t
h
o
d
s
f
o
r
C
h
e
m
i
c
a
l
E
n
g
i
n
e
e
r
s
/
N
o
n
l
i
n
e
a
r
R
e
g
r
e
s
s
i
o
n
U
s
i
n
g
t
h
e
N
o
n
l
i
n
e
a
r
R
e
g
r
e
s
s
i
o
n
R
o
u
t
i
n
e
s
First we need to create a function that takes as inputs a
vector b, the model parameters, and a vector (or matrix) x,
the data points of the observed variables
, and returns as
output a vector (or matrix) y, the model responses
Then we use one of the nonlinear regression routines:
13
S
S
a
a
r
r
a
a
h
h
D
D
u
u
c
c
l
l
o
o
s
s
I
I
v
v
e
e
t
t
i
i
c
c
h
h
/
N
u
m
e
r
i
c
a
l
M
e
t
h
o
d
s
f
o
r
C
h
e
m
i
c
a
l
E
n
g
i
n
e
e
r
s
/
N
o
n
l
i
n
e
a
r
R
e
g
r
e
s
s
i
o
n
P
l
o
t
t
i
n
g
t
h
e
F
i
t
t
e
d
C
u
r
v
e
s
Plotting is as simple as calling the cost function or the
predict routine of the NonLinearModel
14
S
S
a
a
r
r
a
a
h
h
D
D
u
u
c
c
l
l
o
o
s
s
I
I
v
v
e
e
t
t
i
i
c
c
h
h
/
N
u
m
e
r
i
c
a
l
M
e
t
h
o
d
s
f
o
r
C
h
e
m
i
c
a
l
E
n
g
i
n
e
e
r
s
/
N
o
n
l
i
n
e
a
r
R
e
g
r
e
s
s
i
o
n
T
u
k
e
y
-
A
n
s
c
o
m
b
e
P
l
o
t
s
Plot of residuals vs. fitted values
15
S
S
a
a
r
r
a
a
h
h
D
D
u
u
c
c
l
l
o
o
s
s
I
I
v
v
e
e
t
t
i
i
c
c
h
h
/
N
u
m
e
r
i
c
a
l
M
e
t
h
o
d
s
f
o
r
C
h
e
m
i
c
a
l
E
n
g
i
n
e
e
r
s
/
N
o
n
l
i
n
e
a
r
R
e
g
r
e
s
s
i
o
n
N
o
r
m
a
l
P
r
o
b
a
b
i
l
i
t
y
P
l
o
t
16
S
S
a
a
r
r
a
a
h
h
D
D
u
u
c
c
l
l
o
o
s
s
I
I
v
v
e
e
t
t
i
i
c
c
h
h
/
N
u
m
e
r
i
c
a
l
M
e
t
h
o
d
s
f
o
r
C
h
e
m
i
c
a
l
E
n
g
i
n
e
e
r
s
/
N
o
n
l
i
n
e
a
r
R
e
g
r
e
s
s
i
o
n
E
s
t
i
m
a
t
i
o
n
o
f
t
h
e
C
o
n
f
i
d
e
n
c
e
I
n
t
e
r
v
a
l
s
17
S
S
a
a
r
r
a
a
h
h
D
D
u
u
c
c
l
l
o
o
s
s
I
I
v
v
e
e
t
t
i
i
c
c
h
h
/
N
u
m
e
r
i
c
a
l
M
e
t
h
o
d
s
f
o
r
C
h
e
m
i
c
a
l
E
n
g
i
n
e
e
r
s
/
N
o
n
l
i
n
e
a
r
R
e
g
r
e
s
s
i
o
n
A
s
s
i
g
n
m
e
n
t
1
18
S
S
a
a
r
r
a
a
h
h
D
D
u
u
c
c
l
l
o
o
s
s
I
I
v
v
e
e
t
t
i
i
c
c
h
h
/
N
u
m
e
r
i
c
a
l
M
e
t
h
o
d
s
f
o
r
C
h
e
m
i
c
a
l
E
n
g
i
n
e
e
r
s
/
N
o
n
l
i
n
e
a
r
R
e
g
r
e
s
s
i
o
n
A
s
s
i
g
n
m
e
n
t
1
19
S
S
a
a
r
r
a
a
h
h
D
D
u
u
c
c
l
l
o
o
s
s
I
I
v
v
e
e
t
t
i
i
c
c
h
h
/
N
u
m
e
r
i
c
a
l
M
e
t
h
o
d
s
f
o
r
C
h
e
m
i
c
a
l
E
n
g
i
n
e
e
r
s
/
N
o
n
l
i
n
e
a
r
R
e
g
r
e
s
s
i
o
n
A
s
s
i
g
n
m
e
n
t
1
(
C
o
n
t
i
n
u
e
d
)
20
S
S
a
a
r
r
a
a
h
h
D
D
u
u
c
c
l
l
o
o
s
s
I
I
v
v
e
e
t
t
i
i
c
c
h
h
/
N
u
m
e
r
i
c
a
l
M
e
t
h
o
d
s
f
o
r
C
h
e
m
i
c
a
l
E
n
g
i
n
e
e
r
s
/
N
o
n
l
i
n
e
a
r
R
e
g
r
e
s
s
i
o
n
6.
Perform a non linear regression using the updated model.
What coefficients are significant?
Did the model improve the TA and QQ plots?
A
s
s
i
g
n
m
e
n
t
2
A
n
e
x
p
e
r
i
m
e
n
t
w
a
s
c
o
n
d
u
c
t
e
d
t
o
e
v
a
l
u
a
t
e
t
h
e
e
f
f
e
c
t
o
f
t
w
o
d
i
f
f
e
r
e
n
t
m
e
t
h
i
o
n
i
n
n
u
t
r
i
t
i
o
n
s
u
p
p
l
e
m
e
n
t
s
(
s
o
u
r
c
e
A
a
n
d
s
o
u
r
c
e
B
)
o
n
t
h
e
g
r
o
w
t
h
o
f
n
e
w
b
o
r
n
t
u
r
k
e
y
s
.
T
h
e
t
u
r
k
e
y
s
w
e
r
e
s
e
p
a
r
a
t
e
d
i
n
t
o
1
0
e
x
p
e
r
i
m
e
n
t
a
l
u
n
i
t
s
w
i
t
h
1
5
b
i
r
d
s
e
a
c
h
.
F
o
r
e
a
c
h
s
u
p
p
l
e
m
e
n
t
,
t
h
e
a
m
o
u
n
t
f
e
d
w
a
s
v
a
r
i
e
d
b
e
t
w
e
e
n
0
.
0
4
%
a
n
d
0
.
4
4
%
o
f
t
h
e
t
o
t
a
l
f
o
o
d
.
T
h
e
t
a
r
g
e
t
v
a
r
i
a
b
l
e
,
t
h
e
m
e
a
n
b
o
d
y
w
e
i
g
h
t
o
f
t
h
e
u
n
i
t
s
,
i
s
e
x
p
r
e
s
s
e
d
a
s
a
f
u
n
c
t
i
o
n
o
f
t
h
e
d
o
s
a
g
e
o
f
t
h
e
t
w
o
s
u
p
p
l
e
m
e
n
t
s
,
a
c
c
o
r
d
i
n
g
t
o
t
h
e
f
o
l
l
o
w
i
n
g
n
o
n
-
l
i
n
e
a
r
m
o
d
e
l
w
h
e
r
e
Y
i
s
t
h
e
m
e
a
n
w
e
i
g
h
t
,
a
n
d
x
A
a
n
d
x
B
a
r
e
t
h
e
d
o
s
a
g
e
s
o
f
t
h
e
t
w
o
s
u
p
p
l
e
m
e
n
t
s
,
r
e
s
p
e
c
t
i
v
e
l
y
.
21
S
S
a
a
r
r
a
a
h
h
D
D
u
u
c
c
l
l
o
o
s
s
I
I
v
v
e
e
t
t
i
i
c
c
h
h
/
N
u
m
e
r
i
c
a
l
M
e
t
h
o
d
s
f
o
r
C
h
e
m
i
c
a
l
E
n
g
i
n
e
e
r
s
/
N
o
n
l
i
n
e
a
r
R
e
g
r
e
s
s
i
o
n
E
x
e
r
c
i
s
e
2
(
C
o
n
t
i
n
u
e
d
)
The model assumes that the intercept
θ
1
and the horizontal
asymptote
θ
1
+
θ
2
are the same for both supplements, and
that only the growth rates
θ
3
*
θ
4
and
θ
3
for supplements A
and B, respectively, are different. The question is whether
one of the supplements is superior, i.e. whether
θ
4
is
significantly different from unity.
22
S
S
a
a
r
r
a
a
h
h
D
D
u
u
c
c
l
l
o
o
s
s
I
I
v
v
e
e
t
t
i
i
c
c
h
h
/
N
u
m
e
r
i
c
a
l
M
e
t
h
o
d
s
f
o
r
C
h
e
m
i
c
a
l
E
n
g
i
n
e
e
r
s
/
N
o
n
l
i
n
e
a
r
R
e
g
r
e
s
s
i
o
n
A
s
s
i
g
n
m
e
n
t
2
1.
Find online the data file turkeyweight.dat and some code
to load the data into Matlab.
2.
Find suitable initial values for the parameters by linearizing
the model.
If you cannot solve this use
θ
1
= 638,
θ
2
= 175,
θ
3
= 5 and
θ
4
= 1.
3.
Write a model function of the form
function
function
y = turkeymodel(theta, x)
y = turkeymodel(theta, x)
4.
Perform the nonlinear regression, using
nlinfit
nlinfit
or
NonLinearModel
NonLinearModel
.
5.
Are the growth rates for the two supplements significantly
different, i.e. is
θ
4
significantly different from unity?
Use either
nlparci
nlparci
or
coefCI
coefCI
to estimate the confidence intervals.
23
S
S
a
a
r
r
a
a
h
h
D
D
u
u
c
c
l
l
o
o
s
s
I
I
v
v
e
e
t
t
i
i
c
c
h
h
/
N
u
m
e
r
i
c
a
l
M
e
t
h
o
d
s
f
o
r
C
h
e
m
i
c
a
l
E
n
g
i
n
e
e
r
s
/
N
o
n
l
i
n
e
a
r
R
e
g
r
e
s
s
i
o
n
Nonlinear regression plays a crucial role in analyzing chemical kinetics, as seen in the application of the Michaelis-Menten model to Puromycin kinetics. The process involves modeling enzyme reaction velocities, linearizing the model for regression analysis, and deriving insights for further analysis and experimentation. Sarah Duclos Ivetich from ETH Zurich provides valuable insights and examples in this area of study.

Download Presentation

Please find below an Image/Link to download the presentation.
The content on the website is provided AS IS for your information and personal use only. It may not be sold, licensed, or shared on other websites without obtaining consent from the author.If you encounter any issues during the download, it is possible that the publisher has removed the file from their server.
You are allowed to download the files provided on this website for personal or commercial use, subject to the condition that they are used lawfully. All files are the property of their respective owners.
The content on the website is provided AS IS for your information and personal use only. It may not be sold, licensed, or shared on other websites without obtaining consent from the author.
E N D
Presentation Transcript
Nonlinear Regression ( ) = + , Y f x i i i Sarah Duclos Ivetich ETH Zurich, Institut f r Chemie- und Bioingenieurwissenschaften ETH H nggerberg / HCI F106 Z rich E-Mail: sarah.duclos@chem.ethz.ch https://shihlab.ethz.ch/education/Snm/statistics.html Sarah Duclos Ivetich/ Numerical Methods for Chemical Engineers / Nonlinear Regression 1
Example: Puromycin Puromycin is an antibiotic used in bio-research to select cells modified by genetic engineering The Michaelis-Menten model for enzyme kinetics relates the initial velocity of an enzymatic reaction to the substrate concentration x by the equation ( ) , f x x = 1 + x 2 At high concentrations, the velocity is essentially constant ( 1), while at low concentrations it is a linear function of the concentration Sarah Duclos Ivetich/ Numerical Methods for Chemical Engineers / Nonlinear Regression 2
Puromycin Kinetics Raw Data 220 200 180 Reaction Velocity [counts/min2] 160 140 120 The model: 100 80 x ( ) = + 1 , f x 60 x 2 40 20 0 0 0.2 0.4 0.6 0.8 1 1.2 Substrate Concentration [ppm] Sarah Duclos Ivetich/ Numerical Methods for Chemical Engineers / Nonlinear Regression 3
Model Linearization The initial model reads x ( ) = , f x 1 + x 2 This can be rearranged to 1 , f x + 1 1 x x = = + 2 2 ( ) x 1 1 1 Renaming the variables yields a linear model = + ( , ) f y y 1 2 Sarah Duclos Ivetich/ Numerical Methods for Chemical Engineers / Nonlinear Regression 4
Linearized Model: Fit Linearized Raw Data 0.022 0.02 0.018 0.016 0.014 1/f 0.012 0.01 Regression Line 1 = 0.0051072 2 = 0.00024722 0.008 0.006 0.004 0 5 10 15 20 25 30 35 40 45 50 55 1/x Sarah Duclos Ivetich/ Numerical Methods for Chemical Engineers / Nonlinear Regression 5
Regression from Linearized Model 220 200 180 Reaction Velocity [counts/min2] 160 140 Regression from linearized model 1 = 195.8 2 = 0.048407 120 100 80 60 40 20 0 0 0.2 0.4 0.6 0.8 1 1.2 Substrate Concentration [ppm] Sarah Duclos Ivetich/ Numerical Methods for Chemical Engineers / Nonlinear Regression 6
Nonlinear Regression The objective function of non-linear regression reads N obs ( ) ( ) 2 = ( , ) i f x S y i = 1 i where y is the vector of responses, x is the vector of observations, is the vector of parameters and f is the nonlinear model function In the 2-parameter case, we can plot S( ) as a function of the parameter values to look for a minimum Sarah Duclos Ivetich/ Numerical Methods for Chemical Engineers / Nonlinear Regression 7
Objective Function S() 0.1 2500 3000 5000 4000 7500 12500 0.09 2000 2500 1800 10000 2000 2500 1600 0.08 2000 3000 3000 1800 5000 1400 4000 1350 1300 0.07 7500 1800 1350 4000 1250 2500 1600 1600 1400 1250 2 5000 1200 2000 0.06 3000 2500 2000 1300 3000 1800 1350 1400 5000 Minimum 4000 7500 4000 1600 0.05 1800 5000 10000 2000 2500 2500 3000 0.04 15000 Estimated value of from linearization 7500 4000 3000 5000 12500 17500 10000 20000 4000 0.03 180 190 200 210 220 230 240 1 Sarah Duclos Ivetich/ Numerical Methods for Chemical Engineers / Nonlinear Regression 8
Minimization of S() If we linearize the model with respect to the parameters, we get ( ) ( ) 0 , , ( ) i i i i f x f x + J 0 where J( 0) is the Jacobian matrix of f with respect to , evaluated at 0 In this case, the residuals are ( 0 ( ) ( ) ( ) f y f = Analogy: = T T X X X Y ) + ( ) J y 0 If we now define the objective function in terms of the residuals, we can apply the Gauss-Newton method ( ) S = = J J ( ) T T T J 0 Sarah Duclos Ivetich/ Numerical Methods for Chemical Engineers / Nonlinear Regression 9
Gauss-Newton Method applied to S() 0.1 2500 3000 5000 4000 7500 12500 0.09 2000 2500 1800 10000 2000 2500 1600 0.08 2000 3000 3000 1800 5000 1400 4000 1350 1300 0.07 7500 1800 1350 4000 1250 2500 1600 1600 1400 1250 2 5000 1200 2000 0.06 3000 2500 2000 1300 3000 1800 1350 1400 5000 Convergence path of Gauss- 4000 7500 4000 1600 0.05 5000 Newton Method ( 1)opt = 212.66 ( 2)opt = 0.064091 1800 10000 2000 2500 2500 3000 0.04 15000 7500 4000 3000 5000 12500 17500 10000 20000 4000 0.03 180 190 200 210 220 230 240 1 Sarah Duclos Ivetich/ Numerical Methods for Chemical Engineers / Nonlinear Regression 10
Nonlinear Regression 220 200 180 Reaction Velocity [counts/min2] 160 Nonlinear Regression 140 Regression from linearized model 120 100 80 60 40 20 0 0 0.2 0.4 0.6 0.8 1 1.2 Substrate Concentration [ppm] Sarah Duclos Ivetich/ Numerical Methods for Chemical Engineers / Nonlinear Regression 11
Matlab Nonlinear Regression Routines There are several options for doing nonlinear regression: lsqcurvefit: Best for quickly fitting models to data; Not much statistical output; Provides more numerical information and options; Can use bounded parameter ranges nlinfit: General nonlinear regression routine; Provides some statistical output NonLinearModel: Most useful for nonlinear regression; All statistical and numerical tools in one place; Works analogously to LinearModel fitnlm: new version of NonLinearModel (since 2013b) Sarah Duclos Ivetich/ Numerical Methods for Chemical Engineers / Nonlinear Regression 12
Using the Nonlinear Regression Routines First we need to create a function that takes as inputs a vector b, the model parameters, and a vector (or matrix) x, the data points of the observed variables, and returns as output a vector (or matrix) y, the model responses Then we use one of the nonlinear regression routines: Sarah Duclos Ivetich/ Numerical Methods for Chemical Engineers / Nonlinear Regression 13
Plotting the Fitted Curves Plotting is as simple as calling the cost function or the predict routine of the NonLinearModel 220 200 180 160 140 120 100 80 60 40 0 0.2 0.4 0.6 0.8 1 1.2 1.4 Sarah Duclos Ivetich/ Numerical Methods for Chemical Engineers / Nonlinear Regression 14
Tukey-Anscombe Plots Plot of residuals vs. fitted values Plot of residuals vs. fitted values 30 25 20 15 Residuals 10 5 0 -5 -10 -15 40 60 80 100 120 Fitted values 140 160 180 200 220 Sarah Duclos Ivetich/ Numerical Methods for Chemical Engineers / Nonlinear Regression 15
Normal Probability Plot Normal Probability Plot 0.95 0.90 0.75 Probability 0.50 0.25 0.10 0.05 -10 -5 0 5 Data 10 15 20 25 Sarah Duclos Ivetich/ Numerical Methods for Chemical Engineers / Nonlinear Regression 16
Estimation of the Confidence Intervals Sarah Duclos Ivetich/ Numerical Methods for Chemical Engineers / Nonlinear Regression 17
Assignment 1 1. Import the data relative to the COVID19 pandemics in Switzerland (covid_19_data_switzerland.csv source: https://corona-data.ch/). https://corona-data.ch/ 2. Plot the data and select only those relative to the first wave (day 2 to 25). Consider first the following exponential model: ? = ???? Sarah Duclos Ivetich/ Numerical Methods for Chemical Engineers / Nonlinear Regression 18
Assignment 1 3. Linearize the model and perform a linear regression using fitlm. Transform back the obtained regression coefficients to have an initial estimate for ? and ?. 4. Use the previously regressed coefficients to fit the non linear model in Matlab by using fitnlm. 5. For each model plot the fitted curves against the data and analyze the TA and QQ plots. How are the two model compared to each other? Consider now the following model: ? = ????+ ? Sarah Duclos Ivetich/ Numerical Methods for Chemical Engineers / Nonlinear Regression 19
Assignment 1 (Continued) 6. Perform a non linear regression using the updated model. What coefficients are significant? Did the model improve the TA and QQ plots? Sarah Duclos Ivetich/ Numerical Methods for Chemical Engineers / Nonlinear Regression 20
Assignment 2 An experiment was conducted to evaluate the effect of two different methionin nutrition supplements (sourceA and sourceB) on the growth of newborn turkeys. The turkeys were separated into 10 experimental units with 15 birds each. For each supplement, the amount fed was varied between 0.04% and 0.44% of the total food. The target variable, the mean body weight of the units, is expressed as a function of the dosage of the two supplements, according to the following non-linear model ( 1 2 1 exp ) ( ) = + + A i B i Y x x 3 4 i where Y is the mean weight, and xAand xBare the dosages of the two supplements, respectively. Sarah Duclos Ivetich/ Numerical Methods for Chemical Engineers / Nonlinear Regression 21
Exercise 2 (Continued) ( ) ( ) 1 exp = + + A i B i Y x x 1 2 3 4 i The model assumes that the intercept 1and the horizontal asymptote 1+ 2are the same for both supplements, and that only the growth rates 3* 4and 3for supplements A and B, respectively, are different. The question is whether one of the supplements is superior, i.e. whether 4is significantly different from unity. Sarah Duclos Ivetich/ Numerical Methods for Chemical Engineers / Nonlinear Regression 22
Assignment 2 1. Find online the data file turkeyweight.dat and some code to load the data into Matlab. 2. Find suitable initial values for the parameters by linearizing the model. If you cannot solve this use 1= 638, 2= 175, 3= 5 and 4= 1. 3. Write a model function of the form function y = turkeymodel(theta, x) 4. Perform the nonlinear regression, using nlinfit or NonLinearModel. 5. Are the growth rates for the two supplements significantly different, i.e. is 4significantly different from unity? Use either nlparci or coefCI to estimate the confidence intervals. Sarah Duclos Ivetich/ Numerical Methods for Chemical Engineers / Nonlinear Regression 23


")
")
")


")

")