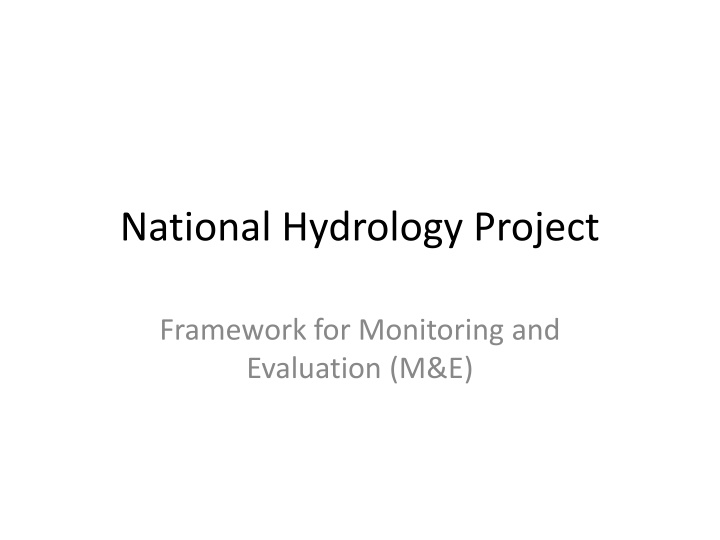
National Hydrology Project
This framework focuses on the importance of Monitoring and Evaluation (M&E) in tracking results, progress, and performance at different levels, demonstrating value, and implementing a results-based M&E system. It highlights the implementation of M&E, staffing requirements, and the importance of M&E at various levels within the National Hydrology Project.

Download Presentation

Please find below an Image/Link to download the presentation.
The content on the website is provided AS IS for your information and personal use only. It may not be sold, licensed, or shared on other websites without obtaining consent from the author.If you encounter any issues during the download, it is possible that the publisher has removed the file from their server.
You are allowed to download the files provided on this website for personal or commercial use, subject to the condition that they are used lawfully. All files are the property of their respective owners.
The content on the website is provided AS IS for your information and personal use only. It may not be sold, licensed, or shared on other websites without obtaining consent from the author.
E N D
Presentation Transcript
National Hydrology Project Framework for Monitoring and Evaluation (M&E)
Why M&E? Help managers at all levels track results, implementation progress and agency performance and so make improvements and corrections Show achievements and emerging issues to managers, decision makers and supervisors Demonstrate the value of the project to politicians and the general public
A four track results-based M&E system for NHP A results-based monitoring and evaluation system to: Track implementation progress against the PIP and the agreed annual work programmes and budgets Track results against the agreed project results framework Track the performance of each IA and each state, based on progress towards the agreed results and on implementation progress Carry out three major assessments of project performance, results and emerging impacts
Implementing M&E M&E staffing An M&E Cell in the National PMU M&E Focal Points in each central and state PMU Support will be provided by the TMC team Preparing the M&E set-up An M&E strategy and plan An M&E work plan for the first three years of implementation. Operating and using the M&E system Based on available data direct from MIS wherever possible Web-based and available via mobile devices Regular summaries each six months, annual M&E reports Used by IAs, decision makers, supervisors, other stakeholders M&E will also be a basis for learning
NHP C. Water Resources Operation and Planning Systems A. Water Resources Data Systems B. Water Resources Information Systems D. Institutional Capacity Enhancement B1. Web-based Water Resources Information Systems D1. Water Resources Knowledge Centers A1. Water Resources Data Acquisition Network C3. Irrigation Design and Operation D2. Professional Development C1. River Basin Modeling C2. Streamflow Forecasting and Reservoir Operation Systems . B2. Water Resources Information Products A2. State and National Water Data Centers C4. Purpose- Driven Studies D3. Project Management
M&E at three levels At the level of the project as a whole, we measure how far we have achieved the overall PROJECT DEVELOPMENT OBJECTIVE At the level of each of the four components, we measure the OUTCOMES (the change or benefit as a result of the project) At the level of each of the eleven sub-components, we measure the OUTPUTS (the products, services or facilities produced by the project) All indicators should be SMART = Specific, measurable, attributable, relevant, time-bound For each outcome and each output, we may monitor several parameters but choose just one Lead Indicator For each indicator, we need to set a baseline and a target
Project Development Objective Objective: Improve the extent, reliability and accessibility of water resources information and strengthen the capacity of water resources management institutions in India. Element of the PDO Improve the extent of water resources information Improve the reliability of water resources information Improve the accessibility of water resources information SMART Indicator Number of operational Hydromet stations % of data that are digitized % of Hydromet stations integrated with on-line state and central databases Number of water resource management institutions conducting water resource assessments as standard practice Strengthen the capacity of water resources management institutions in India SMART = Specific, measurable, attributable, relevant, time-bound
COMPONENT A. Water Resources Data Systems Outcome: Extent and reliability of water resources data improved Outcome indicator: Percentage of data that are digitized
A1. Water Resources Data Acquisition Network Output: Hydromet data acquisition networks established or upgraded Lead output indicator: Number of Hydromet data acquisition systems operating as designed Other output indicators [broken down into: (a) real time (b) other automated; (c) mobile; and (d) other manual]: Number of weather recording stations [broken down between: (i) rain gauges; (ii) automatic weather stations] Number of water level monitoring facilities (rivers, dams/barrages, canals) Number of groundwater level monitoring facilities operating Number of barrages equipped with SCADA Number of water quality monitoring facilities operating
A2. Establishment of State and National Water Data Centres Output: Facilities established or upgraded for automated data collection, collation and processing at state and national levels Lead output indicator: Number of water data centres established and operating as designed Other output indicators: Number of state or national data centres constructed or upgraded Number of items of information technology equipment installed and operational [broken down between: computers; servers; and VC facilities] Number of years of historical data per station digitized (measured in stationyears and in gigabytes) Central hydrologic instrumentation facility operational Number of water quality laboratories operational [broken down between: (a) Level 1; (b) Level 2; and (c) Level 2+ AND between upgraded and new .
COMPONENT B. Water Resources Information Systems Outcome: Strengthened communication and exchange of information amongst states, central government and other stakeholders Outcome indicator: Number of states with water resources information systems (WRIS) integrated with India-WRIS
B1. Web-based Water Resource Information Systems Output: Web-based information systems developed or strengthened at central, regional, river basin and state levels Lead output indicator: India-WRIS and regional, river basin and state level WRIS operating as designed Other output indicators: Number of centres using standardized hydrological data acquisition and processing software and integrated with national: o e-SWIS o e-GEMS o e-WQIS Number of centres having agreed protocols and MoUs for data sharing and that are implementing them Number of centres accessing local and distributed (cloud) data storage operational
B2. Water Resources Information Products Output: Knowledge products and inter-active products and services developed and available through portals and other media Lead output indicator: Number of online national water applications available and used Other output indicators (broken down between central, regional, river basin and state levels): Number of information products on-line (including: high-resolution topographic surveys, earth observation products, ensemble forecast products, web-based analytical tools) Number of registered users Number of times viewed Number of times downloaded Volume of data downloaded (in gigabytes)
C. Water Resources Operation and Planning Systems Outcome: Water information and tools are used to improve water resources allocation and management Outcome indicator: Number of states with water resources assessments and streamflow forecasting systems operational
C1. River Basin Modelling Output: Water resources assessments developed Lead output indicator: Number of river basin models (with dynamic water resource assessments) developed Other output indicators: Centralized modelling framework integrated into India-NWRIS Number of knowledge products based on water accounting
C2. Streamflow Forecasting and Reservoir Operations Systems Output: Models and DSS for streamflow forecasting are developed and in use Lead output indicator: Number of streamflow forecasting stations with improved lead time Other output indicators: Number of sub-basins with flood risk mapping Note: For the economic analysis, M&E will also track changes in reservoir operations and their impact on: (1) averting floods; and (2) reservoir levels and changes in availability of water for downstream use
C3. Irrigation Design and Operation Output: Irrigation performance monitoring and planning are strengthened Lead output indicator: Number and area of irrigation schemes performance benchmarked Other output indicators: Number of agencies using the tools developed for planning and design Number of WUAs and members supported in community-based water monitoring
C4. Purpose-Driven Studies Output: Critical water resources knowledge gaps are filled Lead output indicator: Number of studies and analytical tools published and disseminated Other output indicators: Number of events to disseminate and discuss the studies and analytical tools Number of reservoir sedimentation data assessments published etc.
D. Institutional Capacity Enhancement Outcome: Technical capacity for water resources planning and management is built Outcome indicator: Number of water resource management institutions with at least 50% of staff in relevant divisions trained in water resources management tools
D1. Water Resources Knowledge Centres Output: Water resources knowledge centres are developed and operational Lead output indicator: Number of existing centres developed and new centres operational Other output indicators: National water resources knowledge centre operational Number of sub-national centres operational at basin/regional level or state level
D2. Professional Development Output: Training is delivered and networking and knowledge exchange are facilitated Lead output indicator: Number of persons trained, broken into short term (< 1 month); medium term (1-6 months); long term (> 6 months) Other output indicators: Number of Implementing Agency training needs assessments Number of Implementing agency training programs completed Number of water management courses (national, sub-national level) Number of customized longer term formal training programs Number of broad-based post-graduate courses in WRM Number of courses with international institutions (sandwich courses, short courses) Number of virtual/web-based training courses
D3. Project Management Output: Project activities are managed and facilitated efficiently Lead output indicator: Number of Implementing Agencies (IAs) achieving benchmark performance levels Other output indicators: Technical assistance team (TMC) is in place and delivering according to ToR (YES/NO) Number of states satisfied with services of TMC Project procurement is on schedule (% lag, by IA) Disbursement rates are on target (% lag, by IA) Number of IAs submitting Utilization Certificates on time (% lag, by IA) Unqualified audit reports (number and %) Annual reports and M&E reports complete and timely (number and %)
Next steps on monitoring Refine the definition of outcomes and outputs and the indicators Match the indicators with what is available from the MIS Collect the info on baseline and targets .with priority to agreeing the PDO and lead indicators for outcome and output levels .and to setting baseline and targets at that level Write ToR for TMC support to M&E
Setting baseline and targets Lead Indicator Baseline Target Number of operational Hydromet stations % of data that are digitized % of Hydromet stations integrated with on-line state and central databases Number of water resource management institutions conducting water resource assessments as standard practice Number of states with water resources information systems (WRIS) integrated with India- WRIS Number of states with water resources assessments and streamflow forecasting systems operational Number of water resource management institutions with at least 50% of staff in relevant divisions trained in river basin modelling or flood forecasting
Can we also evaluate impacts? Benefit Data required for impact analysis Past data on flow levels/releases and the corresponding flood losses Data on flow levels and releases for each reservoir Data on actual losses from floods Reduced flooding damages Increased hydropower generation Estimates of the additional water that is available as a result of change in reservoir operations and the additional hydroelectricity generated as a result of this additional water Data on price at which this electricity is supplied. Increased drinking or industrial water supplies Estimates of the additional water that is available as a result of change in reservoir operations The allocation of this additional water for domestic or industrial uses Shadow price of water for domestic or industrial purposes Estimates of the additional water that is available as a result of change in reservoir operations The allocation of this additional water for agricultural uses Shadow price of water for agricultural purposes to be used Increased supplies for irrigation
NHP M&E Thank you very much