Hydrology and Communities: Understanding Flood Events in Boulder 2013
Explore the intersection of hydrology and community data in the context of the 2013 Boulder floods. Discover the various data sources, visualizations, and strategies used to map and assess flood risk in the St. Vrain Watershed. Learn about FEMA's NFHL mapping and the importance of tracking events to enhance flood preparedness.

Download Presentation

Please find below an Image/Link to download the presentation.
The content on the website is provided AS IS for your information and personal use only. It may not be sold, licensed, or shared on other websites without obtaining consent from the author.If you encounter any issues during the download, it is possible that the publisher has removed the file from their server.
You are allowed to download the files provided on this website for personal or commercial use, subject to the condition that they are used lawfully. All files are the property of their respective owners.
The content on the website is provided AS IS for your information and personal use only. It may not be sold, licensed, or shared on other websites without obtaining consent from the author.
E N D
Presentation Transcript
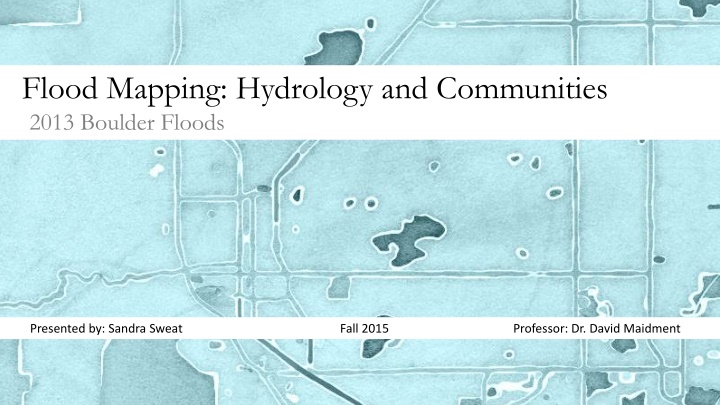
Flood Mapping: Hydrology and Communities 2013 Boulder Floods Presented by: Sandra Sweat Fall 2015 Professor: Dr. David Maidment
Objectives Understand the relationship of hydrology and community data sources. Look at how people interact with flood events. Visualizations: What types of visualizations can be made to represent a flooded area both in GIS and in other representations?
Data Hydrology Community USGS ArcMap connected data FEMA NOAA CMS Census 2010 National Weather Service ESRI Twitter Newspapers Journal and Government Papers Zip Codes
Catchments and Gages Land Cover
Hello, FEMA. NFHL Resulting maps There are 12 data layers in the National Flood Hazard Layer. S_FLD_HAZ_AR A 1% annual chance AE 1% annual chance AO - floodway X 0.2% annual chance
Census Target groups based on loss of life Age 15-24 Age 75+ Buildings Hospitals Dialysis Centers Nursing Homes
Legend Age 75-85 Age 85 +
Legend Age 75-85 Age 85 +
Legend Age 15-19 Age 20-24
Event Tracking Creating a Timeline 1. Streamflow 2. Rainfall 3. Daily Camera Article 4. NWS Storm warnings 5. Twitter manual searching
Flow versus Rainfall September 9th-18th Boulder Creek at Orodell Rainfall in inches Fourmile Creek at Orodell Flow in cfs Boulder Creek Near 75th Hourly Rainfall Boulder Rainfall Accumulation Boulder Time (YYYYMMDD hh:mm)
Twitter 1. Twitter manual searching Keyword search: flood, boulder, emergency, storm, precip, rain Date Range: 9/11 9/18 Agency Searches: NOAA, NWS, Boulder Police
Flow versus Rainfall Daily Camera Storm Warnings Twitter Rainfall in inches Hourly Rainfall Boulder Flow in cfs Rainfall Accumulation Boulder Boulder Creek at Orodell Fourmile Creek at Orodell Boulder Creek Near 75th Time (YYYYMMDD hh:mm)