Modeling and Generation of Realistic Network Activity Using Non-Negative Matrix Factorization
The GHOST project focuses on the challenges of modeling, analyzing, and generating patterns of network activity. By utilizing Non-Negative Matrix Factorization (NMF), realistic network activity patterns can be created and injected into live wireless networks. Understanding and predicting user behavior through tracked network activity is key for network operators to detect anomalies and ensure network capacity.

Download Presentation

Please find below an Image/Link to download the presentation.
The content on the website is provided AS IS for your information and personal use only. It may not be sold, licensed, or shared on other websites without obtaining consent from the author.If you encounter any issues during the download, it is possible that the publisher has removed the file from their server.
You are allowed to download the files provided on this website for personal or commercial use, subject to the condition that they are used lawfully. All files are the property of their respective owners.
The content on the website is provided AS IS for your information and personal use only. It may not be sold, licensed, or shared on other websites without obtaining consent from the author.
E N D
Presentation Transcript
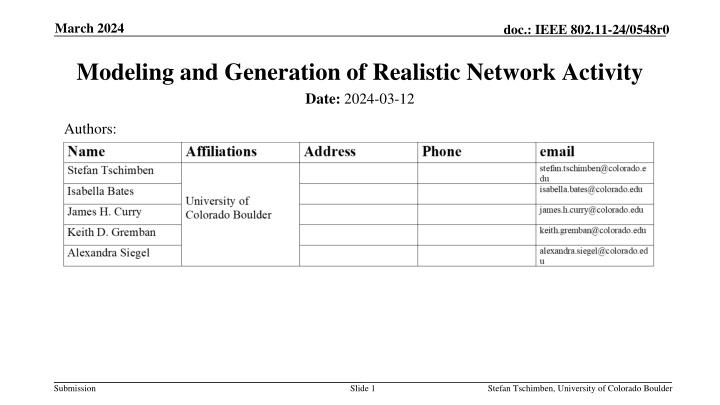
March 2024 doc.: IEEE 802.11-24/0548r0 Modeling and Generation of Realistic Network Activity Date: 2024-03-12 Authors: Submission Slide 1 Stefan Tschimben, University of Colorado Boulder
March 2024 doc.: IEEE 802.11-24/0548r0 Abstract The growing quantity of wireless network activity generated every second of every day creates challenges for network operators, such as detecting anomalies and providing sufficient capacity. This same network activity also creates opportunities for Smart and Connected Systems (SCSs) to adapt to changing population dynamics, detect and proactively adapt to unexpected events such as public safety threats, traffic jams, or adverse weather events, for example. The GHOST project is researching the challenges of modeling, analyzing, and generating patterns of network activity. The GHOST project has demonstrated that Nonnegative Matrix Factorization (NMF) provides a robust mechanism for modeling network activity patterns that can be used to generate realistic network activity. The GHOST team has further demonstrated the capability for injecting programmed activity patterns into a live, functioning wireless network. Submission Slide 2 Stefan Tschimben, University of Colorado Boulder
March 2024 doc.: IEEE 802.11-24/0548r0 Overview Cell phone internet traffic: Risen worldwide from 0.7% in 2009 to over 50% of all traffic by 2023 Further accelerated by 5G Even larger share in Africa: 70% Opportunity for Smart and Connected Systems Use monitored activity to adapt to patterns University of Colorado Boulder One large connected system NSF Convergence Accelerator - Track G GHOST - 5G Hidden Operations through Securing Traffic Submission Slide 3 Stefan Tschimben, University of Colorado Boulder
March 2024 doc.: IEEE 802.11-24/0548r0 Motivation Increasingly challenging for network operators to detect anomalies and ensure sufficient network capacity Tracking network activity can reveal the behavior of users, populations, and organizations Create patterns of life that predict regular behavior and detect changes and inject programmed activity into a live wireless network Network device count at 6:58 am Network device count at 12:40 pm Submission Slide 4 Stefan Tschimben, University of Colorado Boulder
March 2024 doc.: IEEE 802.11-24/0548r0 Non-Negative Matrix Factorization Non-Negative Matrix Factorization (NMF) NMF factors a non-negative matrix Dm x n into two lower rank matrices, W and H D W H Pattern matrix Wm x k Weighted matrix Hk x n Inner dimension k Some limitations to NMF Application of NMF More intuitive Modeling patterns and trends Learning the parts of objects by non-negative matrix factorization , Daniel D. Lee & H. Sebastian Seung Submission Slide 5 Stefan Tschimben, University of Colorado Boulder
March 2024 doc.: IEEE 802.11-24/0548r0 Dataset Dataset provided by UCB Office of Information Technologies (OIT) Data anonymity and irregularities NMF Interpretation W represents activity patterns H represents pattern importance in the original data NMF model simulates user counts at specific locations to mimic real user behavior Submission Slide 6 Stefan Tschimben, University of Colorado Boulder
March 2024 doc.: IEEE 802.11-24/0548r0 NMF Decomposition NMF decomposition can be used to generate scalable patterns of network activity "GHOST activity" can be injected into existing patterns to alter their appearance However: How to inject GHOST traffic into a live wireless network? Fig 1. Make Weekend Look Like a Weekday Fig 2. Injecting a Saturday with GHOST traffic Submission Slide 7 Stefan Tschimben, University of Colorado Boulder
March 2024 doc.: IEEE 802.11-24/0548r0 Model Implementation Wi-Fi Device Simulation: Use a single Raspberry Pi, USB Wi-Fi adapter, and Scapy to recreate authentication process Authentication Association DHCP Web Access Repeat the process for a list of valid MAC addresses Each MAC address is now associated with an IP address provided by the network Can be done quickly (seconds) Submission Slide 8 Stefan Tschimben, University of Colorado Boulder
March 2024 doc.: IEEE 802.11-24/0548r0 Results Network operator view: Expected for a Thursday afternoon: Declining activity and traffic Instead: Increased activity, groups of users passing through the area Peaks of activity and calm periods Baseline: Often vending machines, printers, always-on devices, etc. Submission Slide 9 Stefan Tschimben, University of Colorado Boulder
March 2024 doc.: IEEE 802.11-24/0548r0 Results Submission Slide 10 Stefan Tschimben, University of Colorado Boulder
March 2024 doc.: IEEE 802.11-24/0548r0 Results Submission Slide 11 Stefan Tschimben, University of Colorado Boulder
March 2024 doc.: IEEE 802.11-24/0548r0 Current Work Data Exploration Average Campus Behavior New visualization methods: spectrograms, RGB, 3D Sonification Clustering Capacity Planning and Management Which cluster (type of building) does a new building belong to? Changes over time? Event Classification Sparse Identification of Nonlinear Dynamical systems (SINDy) Submission Slide 12 Stefan Tschimben, University of Colorado Boulder
March 2024 doc.: IEEE 802.11-24/0548r0 Data Exploration Remember: 5-minute time intervals ~5500 access points > 100 buildings Client counts Submission Slide 13 Stefan Tschimben, University of Colorado Boulder
March 2024 doc.: IEEE 802.11-24/0548r0 Data Exploration AERO STRN PDPS Submission Slide 14 Stefan Tschimben, University of Colorado Boulder
March 2024 doc.: IEEE 802.11-24/0548r0 Clustering Normalized data Remove absolute size as a factor Time series decomposed into 3 components NMF and PCA Explain most variability Submission Slide 15 Stefan Tschimben, University of Colorado Boulder
March 2024 doc.: IEEE 802.11-24/0548r0 Clustering Submission Slide 16 Stefan Tschimben, University of Colorado Boulder
March 2024 doc.: IEEE 802.11-24/0548r0 Clustering Clustering: Dormitories Academic Rest : Stadium, Ticket Booth, Rec Center, Indoor Practice Facility, Planetarium, Admin, etc. More features for further clustering? Submission Slide 17 Stefan Tschimben, University of Colorado Boulder
March 2024 doc.: IEEE 802.11-24/0548r0 Capacity Planning & Management Visualizing data in unusual ways Reveal new information Spectrograms Y-axis: access points X-axis: time Color: client counts RGB Color Channels 3 Wi-Fi networks 3 color channels How to display spatial and temporal differences? Submission Slide 18 Stefan Tschimben, University of Colorado Boulder
March 2024 doc.: IEEE 802.11-24/0548r0 Submission Slide 19 Stefan Tschimben, University of Colorado Boulder
March 2024 doc.: IEEE 802.11-24/0548r0 Submission Slide 20 Stefan Tschimben, University of Colorado Boulder
March 2024 doc.: IEEE 802.11-24/0548r0 Submission Slide 21 Stefan Tschimben, University of Colorado Boulder
March 2024 doc.: IEEE 802.11-24/0548r0 Submission Slide 22 Stefan Tschimben, University of Colorado Boulder
March 2024 doc.: IEEE 802.11-24/0548r0 Results Assuming: Commercial electricity rate: Residential electricity rate: Average router power consumption: Extrapolated from 17 weeks of data to the entire year Extrapolated from a single building to the campus data we have access to $0.0916 $0.1105 10 Wh = ~ $25,771/year (commercial) = ~ $31,087/year (residential) Submission Slide 23 Stefan Tschimben, University of Colorado Boulder
March 2024 doc.: IEEE 802.11-24/0548r0 Alternative Visualizations Submission Slide 24 Stefan Tschimben, University of Colorado Boulder
March 2024 doc.: IEEE 802.11-24/0548r0 Alternative Visualizations Submission Slide 25 Stefan Tschimben, University of Colorado Boulder
March 2024 doc.: IEEE 802.11-24/0548r0 Future Work Automated Event Detection using Wi-Fi client count changes Multiple categories of campus events Sliding multi-window (current and future) to detect change in: mean variance periodicity pattern Submission Slide 26 Stefan Tschimben, University of Colorado Boulder
March 2024 doc.: IEEE 802.11-24/0548r0 Conclusion Understanding and adapting to changing patterns of life Monitor geospatial and temporal dynamics Use NMF or PCA decomposition to detect and alter patterns For Wi-Fi: A single device can be used to appear as multiple devices Can be used to replicate patterns detected by NMF Future Work Develop a library of parameterized NMF models Model anomalous events and automatically identify Combine device multiplication with traffic generation Submission Slide 27 Stefan Tschimben, University of Colorado Boulder
March 2024 doc.: IEEE 802.11-24/0548r0 References P. Taylor. (2022) Volume of data/information created, captured, copied, and consumed worldwide from 2010 to 2020, with forecasts from 2021 to 2025. Online; accessed 05-May-2023. T. Bianchi. (2023) Mobile internet traffic as percentage of total web traffic in january 2023, by region. Online; accessed 05-May-2023. J. Mcgrath, A. Davis, J. Curry, O. Gartner, G. Rodrigues, S. Spielman, and D. Massey, Weather of the dorm wifi ecosystem at the university of colorado boulder for fall semester 2019 to spring semester 2020 a case study of wifi and a campus response to the covid-19 perturbation, 2021. J. Schogol. (2022) Russian troops are proving that cell phones in war zones are a very bad idea. Online; accessed 05-May-2023. M. Huffman, A. Davis, J. Park, and J. Curry, Identifying population movements with non-negative matrix factorization from wi-fi user counts in smart and connected cities, 2021 R. Craddock, D. Watson, and W. Saunders, Generic pattern of life and behaviour analysis, in 2016 IEEE International Multi-Disciplinary Conference on Cognitive Methods in Situation Awareness and Decision Support (CogSIMA), 2016, pp. 152 158. Y. Peng, T. Feng, C. Yang, C. Leng, L. Jiao, X. Zhu, L. Cao, and R. Li, Hmm-lstm for proactive traffic prediction in 6g wireless networks, in 2021 IEEE 21st International Conference on Communication Technology (ICCT), 2021, pp. 544 548. S. Li, J. Song, L. Xu, Y. Hu, W. Luo, and X. Zhou, Network traffic prediction based on the feature of newly-generated network flows, in 2022 IFIP Networking Conference (IFIP Networking), 2022, pp. 1 8. N. Gillis, Nonnegative Matrix Factorization. Society for Industrial and Applied Mathematics, 2021. P. Paatero and U. Tapper, Positive matrix factorization: a non-negative factor model with optimal utilization of error estimates of data values, in Fourth International Conference on Statistical Methods for the Environmental Sciences Environmetrics , 1994. D. Lee and H. Seung, Learning the parts of objects by non-negative matrix factorization, Nature, no. 401, pp. 788 791, 1999. M. W. Berry, M. Browne, A. N. Langville, V. P. Pauca, and R. J. Plemmons, Algorithms and applications for approximate nonnegative matrix factorization, Computational Statistics & Data Analysis, vol. 52, no. 1, pp. 155 173, 2007. N. Gillis, The why and how of nonnegative matrix factorization, 2014. Submission Slide 28 Stefan Tschimben, University of Colorado Boulder