Measurement of Dipole Anisotropy of Cosmic Rays

A. Karelin on behalf of the PAMELA
experiment
The measurement of the dipole anisotropy of
protons and helium cosmic rays with PAMELA
experiment
International conference on particle physics and astrophysics

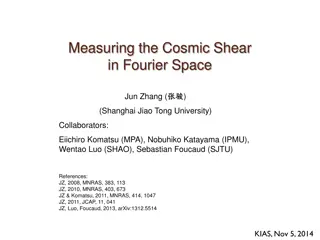
Калориметр ПАМЕЛА
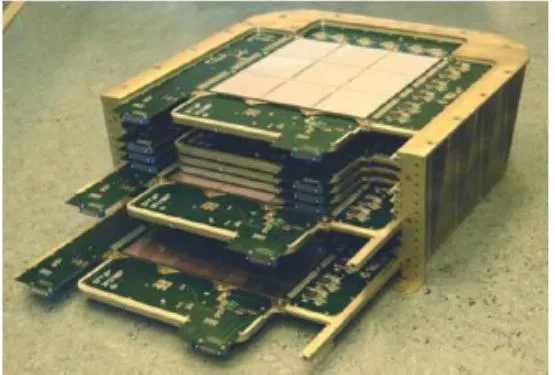
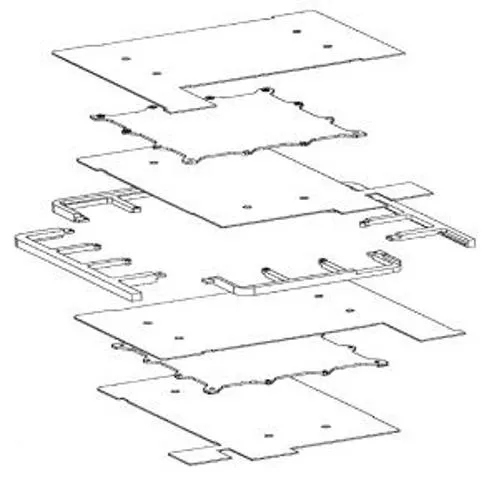
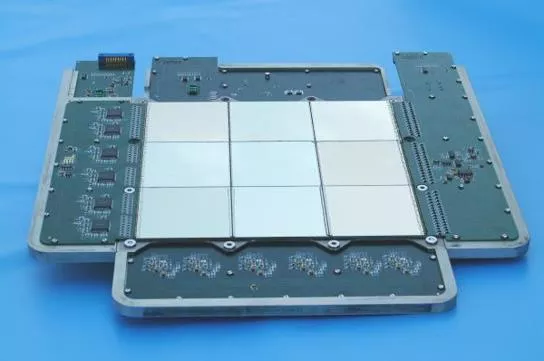
8x8 c
м
2
22
слоя вольфрама
Полная толщина -
16 X
0
Чувствительная поверхность -
24x24 c
м
2
44
слоя кремниевых детекторов
Количество стриповых детекторов
в слое
96
The examples of reconstructed shower
axis inside the calorimeter
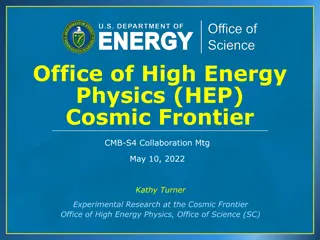
The anisotropy map for 180000 mip
D
крит
=0,1015; D
эксп
=0,3889; P=0,05
5
Перцентильные кривые для реальных и изотропных данных, построенные по
их гистограммам (
x –
кол-во событий в бине)
The whole set of data was divided on two intervals and than those
intervals were shifted with the 5 degree step.
After this procedure each bin contains about 1600000 events. The
threshold is 180000 mip. Particles within the energy range 1-20 TeV.
y=y0+A*sin(pi*(x-xc)/w)
To calculate the amplitude A the curve was fitted
by a periodic function
K=2/pi
A=0,0013±0,003
Ψ
c=70±10
Применение метода к моделированию методом Неймана
The multiple numerical simulation gives
the
coefficient of determination
While in the experiment we have 0,88
that is in the good agreement with the
numerical test
From the review in the book G
«
Homage to the discovery of Cosmic Rays
»
Nova
Science Publishers, New York, 2013 by Di. Sciascio and R. Iuppa
The amplitude A of the sidereal daily variations
From the review in the book G
«
Homage to the discovery of Cosmic Rays
»
Nova
Science Publishers, New York, 2013 by Di. Sciascio and R. Iuppa
The phase
of the sidereal daily variation
ы
Karelin presents the dipole anisotropy measurement of protons and helium cosmic rays at an international conference on particle physics and astrophysics. The data analysis involved dividing the dataset into intervals, shifting intervals with a 5-degree step, and fitting a periodic function to calculate the amplitude. The experiment achieved good agreement with numerical simulations and explored variations in cosmic ray properties

Download Presentation

Please find below an Image/Link to download the presentation.
The content on the website is provided AS IS for your information and personal use only. It may not be sold, licensed, or shared on other websites without obtaining consent from the author.If you encounter any issues during the download, it is possible that the publisher has removed the file from their server.
You are allowed to download the files provided on this website for personal or commercial use, subject to the condition that they are used lawfully. All files are the property of their respective owners.
The content on the website is provided AS IS for your information and personal use only. It may not be sold, licensed, or shared on other websites without obtaining consent from the author.
E N D
Presentation Transcript
A. Karelin on behalf of the PAMELA experiment The measurement of the dipole anisotropy of protons and helium cosmic rays with PAMELA experiment International conference on particle physics and astrophysics
The examples of reconstructed shower axis inside the calorimeter
D=0,1015; D=0,3889; P=0,05 , (x - ) 5
The whole set of data was divided on two intervals and than those intervals were shifted with the 5 degree step. After this procedure each bin contains about 1600000 events. The threshold is 180000 mip. Particles within the energy range 1-20 TeV. 0,0030 0,0025 0,0020 0,0015 0,0010 0,0005 Ir/Is-1 0,0000 -0,0005 -0,0010 -0,0015 -0,0020 -0,0025 -0,0030 0 50 100 150 RA, degree 200 250 300 350
To calculate the amplitude A the curve was fitted by a periodic function 0,004 y=y0+A*sin(pi*(x-xc)/w) K=2/pi A=0,0013 0,003 c=70 10 0,003 0,002 0,001 Ir/Is-1 0,000 -0,001 -0,002 -0,003 -0,004 0 20 40 60 80 100 120 140 160 180 200 220 240 260 280 300 320 340 360 RA, degree
The multiple numerical simulation gives the coefficient of determination While in the experiment we have 0,88 that is in the good agreement with the numerical test
The amplitude A of the sidereal daily variations From the review in the book G Homage to the discovery of Cosmic Rays Nova Science Publishers, New York, 2013 by Di. Sciascio and R. Iuppa
The phase of the sidereal daily variation From the review in the book G Homage to the discovery of Cosmic Rays Nova Science Publishers, New York, 2013 by Di. Sciascio and R. Iuppa


![❤[READ]❤ Cosmic Biology: How Life Could Evolve on Other Worlds (Springer Praxis](/thumb/21556/read-cosmic-biology-how-life-could-evolve-on-other-worlds-springer-praxis.jpg)