Market Concentration and Its Implications

 
Unit Three: Market Conce
ntration
        
3.1 Nature and Theories of Concentration
Market concentration
 refers to the 
situation
situation
in which an 
industry
industry
 or a 
market
market
 is
controlled by a small
 number of 
leading
leading
producers who are exclusively or very largely
engaged in that industry.
Two variables that determinates such situation
are:
the number 
and
size distribution of firms within the market
.
 
 
How these 
two
 
dimensions cause different
forms of the market structure h
aving vital
consequences for the pricing and output
decisions of the firm?
The  implication of market concentration in
industrial economics is far wider than theory
of the firm.
 Market concentration (the degree of sellers'
concentration in the market), is an important
element of the 
market structure
, which plays a
dominant role 
dominant role 
in determining the 
behaviour
of a firm in the market.
A market is said to be 
more concentrated
more concentrated
, the
fewer the number
fewer the number
 of firms.
The "
market structure-conduct-performance
"
requires a means of identifying different market
structures:
concentration in the ownership of the industry
concentration of decision-making power, and
concentration of the firms in a particular location or
region, etc.
All of these elements of market concentration
may have considerable 
impact on the market
performance
performance
 of the firms such as 
profitability
,
growth
, and 
technological
 
progress
.
            3.2 Measuring Market Concentration
Measurement of market concentration help us
to 
test empirically the behavioral hypothesis
about the firms and industries.
Various quantitative indices have been
suggested for this purpose.
 Some of them are used to measure the
monopoly power
 
and some others for 
market
concentration
.
These two terms are 
closely interrelated
 and 
cannot
 
be
separated
 
from each other in the measurement process
of market concentration.
The measures for monopoly power 
:
It would be more appropriate 
at firm level
at firm level
.
They indicate the 
actual monopoly power 
exercised by the
firms.
The measures of concentration
:
 it would give us the 
potential monopoly power 
in the
market or industry 
as a whole
as a whole
.
Market concentration is therefore a 
necessary
condition
 for the monopoly power.
A  market concentration 
measure
 should be 
decreasing
decreasing
as the number of firms in the market keeps on
increasing.
Some of the general conditions that should be
satisfied by each one of the indices are:
The measure must yield 
unambiguous ranking
unambiguous ranking
 of
industries by concentration.
The concentration measure should be 
a function of
a function of
the combined market share
 of firms rather than the
absolute size of the market or industry.
If the number of firms increases, then concentration
should decrease.  However, if the new entrant is large
enough, then concentration may go up.
If there is 
transfer of sales
transfer of sales
 from a 
small firm
small firm
 to 
a
large one 
in the market, then concentration increases.
Proportionate decrease 
in the market share of all firms
reduces the concentration by the 
same proportion
.
Merger activities increase the degree of concentration.
It may not be possible for an index of
concentration to satisfy all of the above
conditions.
There are several measures suggested for
measuring market concentration all of which are
not equally good or bad i.e., 
there is no perfect
there is no perfect
or the best index for concentration or
monopoly power.
monopoly power.
A measure of market concentration tries to
transform the information on the number, size and
distribution of firms presented on the
concentration curve into a single value.
3.3 The Concentration Curve and Measures of
Market Concentration
The 
Market concentration Curves 
plot the
cumulative market share
 from the 
largest
 to the
smallest
.
It may provide information on the 
structural
structural
characteristics
characteristics
 of the market.
Graphs between cumulative number of firms from
largest to smallest (X-axis) and cumulative
percentage of market supply (Y-axis) are shown
by points: A, B & C for three industries
separately. (See the following graph).
 
Fig 3.1: The Market Concentration Curve
Market A is the highly concentrated industry.
For the first five largest firms, market C is
more concentrated than B. But, for the
number of firms greater than five, market B is
more concentrated than C.
There are six main measures of concentration.
i. Concentration Ratio (C
r)
: is the 
most popular
most popular
and 
simplest
simplest
 index for measurement of
market concentration or monopoly power. It is
defined 
as the share of market held by some
of the largest firms in the marke
t
t
.


More specifically, it is defined as a proportion
of market share accounted by 
r largest firms
r largest firms
,
where r is an arbitrary number. The normal
practice is to take r = 4.
Where S
i
 is the percentage of market share of firm
i.
The 
higher
higher
 
the concentration ratio
, the greater will
be the 
monopoly power 
monopoly power 
or market concentration
existing in the industry.
If C
r
 is close to zero percent, then the largest ‘r’
firms 
supply a small share 
of the market.
If C
r
 is closer to 100%, it implies there high
market concentration i.e. the largest ‘r’ firms
supply the largest share 
of the market.
 It is possible to calculate the 
C
r
 on the basis of
value added
value added
, 
total employees
total employees
, 
market supply
market supply
, etc.
 
 
Example :
We have eight firms in Edible Oil
market. The information  given in the table
below will show us the market share of each
firm. Now using the information below,
compute the concentration ratio of the higher
four firms.


Now the first thing we do is to identify the four
largest firms based on their market share. We
will put then in descending order as you can
see in the table below.
 
 
Now using the formula given for concentration
ratio, we can get the monopoly power of these
four firms. The value of the concentration ratio
is 0.9 or in other word the four firms took 90
percent of the total market.
         Limitation of the concentration ratio
 T
his index has two limitations: 
the arbitrary
the arbitrary
selection of r
selection of r
 
and 
only a single point on the
concentration curve 
concentration curve 
is taken without information
on the size distribution of the ‘r’ firms.
The Arbitrary Selection of ‘r’ - when the
concentration curves intersect, the measure (C
r
)
will give different ranking of industries for
different values of ‘r’.
 For instance, at C
r3, 
firm C is more concentrated
than B.  But at C
r6
 market B is more concentrated
than market C.
The basic problem with Concentration ratio is that
it provides 
no information about the size
distribution of the r’ firms
 
chosen for
constructing the ratio.
Suppose in industry A where there are four firms,
the largest firm has 97% market share and the
other three account for 1% each.
In industry B there are four firms each with a
market share of 25%.
For both industries (A&B) Cr
4
 = 100% although
the market structure is different.
That is, 
market A
market A
 is more or less a monopoly
market.
(ii)
The Hirschman-Herfindahl (HHI)Index:
Unlike the concentration ratio (Cr), the HHI
takes into account 
all points on the
all points on the
concentration curve
concentration curve
.
HHI is the 
sum
sum
 of the 
squares
squares
 of the relative
sizes (or market shares) of 
all firms 
all firms 
in the
market, where the relative sizes are expressed
as proportions of the total size of the market.
Mathematically, the HHI index is given by:
 
Where 
S
S
i
i
 = q
 = q
i
i
/Q
/Q
, q
i
 is output of 
i
th
 firm and Q is
total output of all the firms in the market, and 
n
n
 is
the total number of firms in the industry.
The index is 
close to zero 
close to zero 
when there is 
large
large
number of equal sized firms
, or equal to 
one
one
under monopoly
under monopoly
. The HHI has two 
principal
advantages
:
Squaring the individual market shares gives 
more
more
weight
weight
 to the shares of the larger firms.
It uses information about the market share of 
all
all
relevant firms
relevant firms
.
The HHI gives 
added weight to the biggest
industries.
The higher the index, the more the market
concentration and (within limits) the less open
market competition.
Example
We have six firms in a given computer market.
The following table shows the market share of
the firm.


Using the formula above, first you can
compute the square of each market share of a
given firm. After that just take the summation
of the square of each market shares. It will
give you the value of the Hirschman –
Herfindahl index. That is 0.018 the value
indicates that monopoly power of the firms is
very low.
A monopoly, for example, would have
Hirschman-Herfindahl index of S1
2
 or 100
2
, or
10,000. By definition, that is the maximum score.
By contrast, an industry with 100 competitors that
each has 1% of the market would have a score of
1
2
 + 1
2
 + 1
2
+ ... + 1
2
 or a total of 100.
 The more typical situation might be a 
duopoly
.
If each of the two firms has a market share of
50%, the
 
Hirschman-Herfindahl index would be
(50)
2
 + (50)
2
 = 2500 + 2500 = 5000.
With two firms that have of 75% and 25%
respectively, the
 
Hirschman-Herfindahl index
would be: (75)
2
+ (25)
2
 = 5,625 + 625 = 6,250
In recognition of its advantage, the HHI has
been accepted as a measure of concentration in
the United State of America, especially as a
guideline to decide 
merger
 cases.
According to the guidelines to decide merger
cases un-concentrated markets are defined, as
those in which HHI is 1000 or less which is
equivalent to 10 equal sized firms.
In this situation mergers (at least two firms
merged in each other) leading to a rise of HHI
= 200 points are challenged or disallowed.
A market is assumed to be concentrated if HHI
is 1800 or more which is roughly equivalent to
five equal sized firms.
 Each one has a share of 20%. In this case
mergers leading to a 100 point or more rises in
HHI are rejected or challenged.
When two firms with market share of S
1
 and
S
2
 merge the HHI increases by 2S
1
S
2
.
 The purpose of disallowing merger is that it
may lead to a 
monopoly
monopoly
 
situation
situation
.
iii. 
Entropy Index
:  it is 
quite recently
 to
measure the degree of market concentration.
Market concentrations are 
weighted by the
weighted by the
logarithms of the market shares
.
It uses the following formula:
        0
<
 E 
< 
log (n)
where 
EI
 is defined as 'Entropy coefficient.'
 
It uses the formula where E is defined as Entropy
Coefficient, P
i 
is the market share of i
th
 firm and
‘n’ the number of firm.
This coefficient in fact measures the 
degree of
market uncertainty faced 
by a firm in relation to
a given customer.
This will be the situation when number of 
firms is
large enough
, i.e., market is 
not concentrated
not concentrated
.
For a monopoly firm (n=1) the Entropy
coefficient takes the 
value of zero
 which means
no uncertainty
no uncertainty
 and there is 
maximum
maximum
concentration
concentration
.
 
Thus, we find 
inverse relationship
 between the
Entropy coefficient (EI) and the degree of market
concentration.  If there are ‘n’ firms, all equal in size,
then:
 
 
EI is similar to HHI, but the difference is that EI gives
relatively 
more weight to the smaller firms
.
Numerical Example
We have six firms in a given Mobile market. The
following table shows the market share the firms.


iv. 
The Dispersion method 
:
 is an index used to measure
equality/ inequality using 
Gini coefficient (GC)
.
 It is used to plot 
cumulative market share 
against the
cumulative percentage of firms
.
In this case, firms are cumulated from the 
smallest to
smallest to
the largest
the largest
 unlike that of the concentration curve.
That is, the Gini (or Lorenz curve) shows the variation
in cumulative percentage distribution of 
market share
market share
with cumulative 
distribution of firms 
from 
smallest
 to
largest
 in the market (as shown in figure below).
 
Fig: 3.2: The Lorenz Curve
In figure 3.2, Line OA is line of perfect equality,
representing 
equal sized firms
. Curves 2 & 3
represent Lorenz Curve.
Greater inequality results if Lorenz curve is
farther from line of equality. Curve 3 thus reflects
highest inequality.
A coefficient which we may call 'Lorenz
coefficient' or 'GINI-coefficient' is obtained by
dividing  the area bounded between the Lorenz
curve (say curve-2) and the diagonal line OA {
shown with rectangles in it } by the area of the
triangle under the diagonal (OAC).
That is,
In all case, 0 
<
 GC 
< 
1; greater the magnitude
of GC say 0.5, 0.6 or 0.7 higher inequality
exists and vice versa.
Limitation of Gini coefficient: 
one basic
problem with GC is that it favors equality of
market shares without regard to 
the number of
the number of
equal sized firms
equal sized firms
, i.e. GC equal to zero for
two firms with 50% market share each or 3
firms with 33.3% market share each, etc.
 
 Thus, GC=0 implies equal level of
competition.
 But this is not always true because the level of
competition 
differs
 with the 
number of firms
number of firms
but 
not equal size
 firms.
Sufficient and accurate data about the market
share of every firm in the market may not be
available.
VI. The Lerner Index (LI)
:  is the 
best
 
known
measure of monopoly power. It is expressed
as:
    
 
LI =                           =
The greater the 
deviation
 between price &
MC, the 
higher
 the monopoly power of the
firm & the greater the market concentration.
LI = 0 for perfect competition (since P=MC).
Note that for profit maximization we have the
familiar condition MR = MC, and MR = P (1-
1/e).
Thus, from these two equations, we get the
Lerner index as:


By substitution, we have:
 
Where 
e
e
 is the price elasticity of demand and
hence, LI is the inverse of e, which is price
elasticity of demand.


Example:
Suppose firms are operating in two markets:
Market 1
 where Price of the product is 
100 birr
and marginal cost of production is 
25 birr
 and
Market 2
 where Price of the product is 
50 birr
and marginal cost of production is 
20
 birr
Compute Learner index for both Market
Which market is more concentrated?
 
 
IV. The Elasticity Index
The ratio of ‘own elasticity of demand’ and
‘cross–elasticity of demand’ for a firm could
be used as a measure of monopoly power or
market concentration in terms of ‘number –
equivalent’ i.e.
 
 
Where e
ii
= own elasticity of demand e
ji
 and =
cross elasticity of demand.
An increase in the ratio means lesser number
of firms in the market and a decrease means
higher number.
 
 
Example
The product own elasticity of demand of a commodity
was 0.15 and cross demand elasticity of the product was
0.60. The number of the firm in this year was ten.
Compute the elasticity index


This indicates the ratio is very high or the number
of firms is very less.
3.4 Concentration and the market performance
We know that a firm with substantial monopoly power
will tend to:
charge higher price
produce and sell less output
make high rate of profit
grow faster than others
capable of doing anything it wants in connection with its
business such as: R & D, advertisement, etc.
If we assume that concentration is appropriate measure
of monopoly power, we are then in a position to verify
the various propositions of the economic theory which
reflects the relationship between concentration and
market performance of the firm.
i. Concentration and profit
: a firm derives the
market power or monopoly power in the situation
of concentration.
Such a market power, through market conducts
activities or directly leads to an 
increase to
profitability 
of the firm.
It is frequently assumed that persistence of 
high
high
rates of profits
rates of profits
 over a long period of time is the
consequence of high degree of intra-industry
concentration.
Bain was the first to make empirical study on the
relationship between concentration 
and
and
 profi
 profi
t
.
He argued that there is 
strong linkag
e between
the 
two
two
 and hence 
profit rate
profit rate
 can be a 
measure of
concentration.
However, there are some difficulties in
establishing the correct relationship between
concentration
 and 
profit
 as both are subject to
ambiguities
ambiguities
 of measurements.
For example, since we do have various measures
of concentration, we do not know which one is
the best measure of concentration. If one measure
of concentration is selected, it may have strong
correlation with profit but if another indicator of
concentration is used it may have weak
correlation with profit
.
Further, the measurement of profit is 
not free
not free
from weaknesses.
from weaknesses.
For example, it is often based on 
accounting
accounting
data
data
 which ignores certain 
opportunity cost
opportunity cost
elements that are related to 
own fund
own fund
, own
building
building
 and own 
entrepreneurial
entrepreneurial
 ability.
All in all, there is 
positive relationship
between profit rate and degree of market
concentration 
concentration 
on the basis of theoretical logic,
though the very precise estimation of which is
yet to come.
? Researchable area????????????????????
ii. Concentration and Price – Cost Margins
: Price
margin is another way to define profitability.
 It is a 
short term 
short term 
view of profitability based on
current assets and cost figures.
 Average price – cost margin is just a ratio of
these two magnitudes.
Some empirical studies supported the 
positive
relationship between concentration and price-
cost margin.
However, some other studies indicate
insignificant relationships between the two
variables.
? Need a research. Hence, think over it.???????
iii. Concentration and growth of the firm
: there
are two different views (streams of thoughts) to
explain the actual relationship between
concentration and growth.
First view
First view
: a firm with the market power may
prefer to maintain its high rates of profits by
restricting output and charging high price.
 If it grows, it has to scarify some 
profit margin
and lower price 
which may 
not be in its interest
.
Moreover, there will be all kinds of government
restrictions to stop further growth of the firm.
Static diseconomies of scale and other bottle necks all
adversely affect the growth of such a firm.
 Thus, we expect 
the
the
 
higher the monopoly power
, 
the
lesser
lesser
 may be the growth of the firm.
Second view
Second view
: sees positive relationship between
concentration and growth of the firm.
To maximize the long term profit
, firms may like to grow
over time even under market concentration.
They may 
create excess capacity to meet the future
growing demand
growing demand
 and
to discourage new entry in the market.
For these firms may 
sacrifice some profit to stimulate
long term growth
. Thus, we find a case for positive
relationship between initial market concentration and
growth of the firm.
iv.  Concentration and Technological Progress
we know that
 
few firms 
few firms 
that enjoy monopoly
power in concentrated industries will be 
large
large
enough
enough
.
They will be having 
stability
stability
, 
financial resource
financial resource
and ability to 
initiate the process of R& D 
and
again the benefit from them.
Some recent researches show the situation when
the market is 
concentrated
concentrated
 and 
innovative
innovative
activities 
activities 
are positively correlated.
 However, there is no conclusive empirical
evidence to prove such proposition.
???? You call for research???????????
Some argue that it may not be the
concentration but the other attributes of market
structure like the 
size of the firm
, 
product
product
differentiation possibilities
 that may be
having collinearity with concentration and thus
causing a spurious positive correlation
between concentration and technological
change.
Nothing can be said in either way about the
relationship. 
It is open for further empirical
verification.
verification.
 Ditto??????????????????
v. Concentration and other aspects of market performance:
stability
stability
 
in the business
in the business
, which may be judged either by
persistent profit rates or sales volume or market share, is
one of the indicators of performances.
Greater the market performance of a firm, the more we
expect its stability. Uncertainty faced by the firm may be
smaller.
Further, if there is high concentration, in the market the
existing few firms may maintain their size ranking to keep
the leadership with them.
If the size ranking of the firms, which is defined as
‘turnover’, is changing this implies that the competitive
forces are in action in the market. Lack of such changes
means lack of competition and a possible tacit or alright
collusion between competitors and hence a perpetuation of
the market concentration which ensures stability for the few
oligopolistic firms.
 
           3.5 Determinants of Concentration
Why concentration is high in some industries
but not in others?
Two approaches have generally been used as
an explanation of market concentration.
       
 
1)
 
The Deterministic Approach
    
 
2)
 
The Stochastic Approach
In this course we limit ourselves to the first of
the two approaches.
 
The Deterministic Approach (Scale-Economies)
Concentrated market structure could come
from persistent economies of scale.
Scale economies permit 
relatively large
producers to manufacture
 and market their
product 
at lower average cost per unit 
than
relatively small producers
By definition, economies of scale constitute
the relationship between:
 
size of the firm & its costs of production.
This relationship may be explained
(symbolized) by 
the long-run average cost
curve (LAC), 
curve (LAC), 
representing the 
least possible
cost
 for every unit of output.
We can identify various 
relationships
relationships
between average cost and level of output 
as
discussed under the following.
(i) Constant Cost Case
In this case 
no cost advantages or
disadvantages
disadvantages
 are associated with 
large-scale
large-scale
production
production
.
Thus, 
long-run unit production costs
 are
independent
 of the rate of output.
In this case, 
the market structure is
indeterminate.
 
Fig 3.3: Constant Long Run Average Cost
  (
ii) 
Rapid fall in Unit Production Costs
In some cases, unit production costs fall rapidly
and the 
economies of size are not exhausted
until a very large level of output is attained.
This is the case of 
natural monopoly
natural monopoly
. Because of
important scale economies, a single firm can
supply the 
entire
entire
 market demand.
 The market structure is obviously a monopoly
structure. Water supply, electricity supply, and
communication sector are some of the examples.
Fig 3.4: Rapid Fall in the Long Run Average Cost
 (iii) Rapid Rise in Unit Production Costs
In some circumstances, the LAC rapidly rises.
This is the mirror image of natural monopoly.
Economies of scale are 
negligible
 and
diseconomies
diseconomies
 are encountered at relatively
small rates of output.
A typical firm would operate on a 
modest
modest
scale & the 
market structure is competitive
.
There would be a large number of small firms
in the market.


Fig: 3.6: Rapid Rise in the LAC
  
(iv) Constant Range of Minimum LAC Curve:
This one represents a situation in which a
small rate of output 
enables the firm to take
advantage of economies of scale.
 That means 
diseconomies
 do 
not
 occur 
until
the output rate is 
quite large
.
Here, one might observe a mixture of a firm
size.  In this case both large and small firms
can co-exist.
Slide Note
Embed
Share

Market concentration refers to industries controlled by a small number of leading producers, impacting pricing and output decisions. Various theories, measurement methods, and implications on firm behavior and performance are discussed, highlighting the relationship between monopoly power and market concentration.

  • Market Concentration
  • Industrial Economics
  • Firm Behavior
  • Monopoly Power
  • Market Structure

Uploaded on Jul 18, 2024 | 0 Views


Download Presentation

Please find below an Image/Link to download the presentation.

The content on the website is provided AS IS for your information and personal use only. It may not be sold, licensed, or shared on other websites without obtaining consent from the author. Download presentation by click this link. If you encounter any issues during the download, it is possible that the publisher has removed the file from their server.

E N D

Presentation Transcript


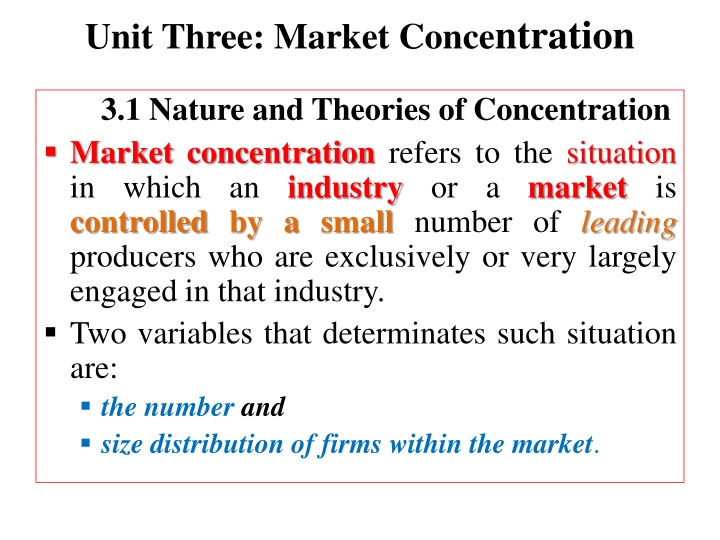
  1. Unit Three: Market Concentration 3.1 Nature and Theories of Concentration Market concentration refers to the situation in which an industry or a market is controlled by a small number of leading producers who are exclusively or very largely engaged in that industry. Two variables that determinates such situation are: the number and size distribution of firms within the market.

  2. How these two dimensions cause different forms of the market structure having vital consequences for the pricing and output decisions of the firm? The implication of market concentration in industrial economics is far wider than theory of the firm. Market concentration (the degree of sellers' concentration in the market), is an important element of the market structure, which plays a dominant role in determining the behaviour of a firm in the market.

  3. A market is said to be more concentrated, the fewer the number of firms. The "market structure-conduct-performance" requires a means of identifying different market structures: concentration in the ownership of the industry concentration of decision-making power, and concentration of the firms in a particular location or region, etc. All of these elements of market concentration may have considerable impact on the market performance of the firms such as profitability, growth, and technological progress.

  4. 3.2 Measuring Market Concentration Measurement of market concentration help us to test empirically the behavioral hypothesis about the firms and industries. Various quantitative suggested for this purpose. Some of them are used to measure the monopoly power and some others for market concentration. indices have been

  5. These two terms are closely interrelated and cannot be separated from each other in the measurement process of market concentration. The measures for monopoly power : It would be more appropriate at firm level. They indicate the actual monopoly power exercised by the firms. The measures of concentration: it would give us the potential monopoly power in the market or industry as a whole. Market concentration is condition for the monopoly power. A market concentration measure should be decreasing as the number of firms in the market keeps on increasing. necessary therefore a

  6. Some of the general conditions that should be satisfied by each one of the indices are: The measure must yield unambiguous ranking of industries by concentration. The concentration measure should be a function of the combined market share of firms rather than the absolute size of the market or industry. If the number of firms increases, then concentration should decrease. However, if the new entrant is large enough, then concentration may go up. If there is transfer of sales from a small firm to a large one in the market, then concentration increases. Proportionate decrease in the market share of all firms reduces the concentration by the same proportion. Merger activities increase the degree of concentration.

  7. It may not be to possible satisfy for all an index the of concentration conditions. There measuring market concentration all of which are not equally good or bad i.e., there is no perfect or the best index monopoly power. A measure of market concentration tries to transform the information on the number, size and distribution of firms concentration curve into a single value. of above are several measures suggested for for concentration or presented on the

  8. 3.3 The Concentration Curve and Measures of Market Concentration The Market concentration cumulative market share from the largest to the smallest. It may provide information on the structural characteristics of the market. Graphs between cumulative number of firms from largest to smallest (X-axis) and cumulative percentage of market supply (Y-axis) are shown by points: A, B & C for three industries separately. (See the following graph). Curves plot the

  9. Fig 3.1: The Market Concentration Curve

  10. Market A is the highly concentrated industry. For the first five largest firms, market C is more concentrated than B. But, for the number of firms greater than five, market B is more concentrated than C. There are six main measures of concentration. i. Concentration Ratio (Cr): is the most popular and simplest index for measurement of market concentration or monopoly power. It is defined as the share of market held by some of the largest firms in the market.

  11. More specifically, it is defined as a proportion of market share accounted by r largest firms, where r is an arbitrary number. The normal practice is to take r = 4. r r X X = = = + + + i C S S S S S 1 2 3 4 r i = = 1 1 i i

  12. Where Si is the percentage of market share of firm i. The higher the concentration ratio, the greater will be the monopoly power or market concentration existing in the industry. If Cr is close to zero percent, then the largest r firms supply a small share of the market. If Cr is closer to 100%, it implies there high market concentration i.e. the largest r firms supply the largest share of the market. It is possible to calculate the Cr on the basis of value added, total employees, market supply, etc.

  13. Example :We have eight firms in Edible Oil market. The information given in the table below will show us the market share of each firm. Now using the information below, compute the concentration ratio of the higher four firms.

  14. S.N Name of a firm Market share in percentage 1 Firm 1 25 2 Firm 2 1 3 Firm 3 4 4 Firm 4 20 5 Firm 5 3 6 Firm 6 2 7 Firm 7 15 8 Firm 8 30

  15. Now the first thing we do is to identify the four largest firms based on their market share. We will put then in descending order as you can see in the table below. S.N Name of a firm Market share in percentage 1 Firm 8 30 2 Firm 1 25 3 Firm 4 20 4 Firm 7 15 Total 90

  16. Now using the formula given for concentration ratio, we can get the monopoly power of these four firms. The value of the concentration ratio is 0.9 or in other word the four firms took 90 percent of the total market.

  17. Limitation of the concentration ratio This index has two limitations: the arbitrary selection of r and only a single point on the concentration curve is taken without information on the size distribution of the r firms. The Arbitrary Selection of r - when the concentration curves intersect, the measure (Cr) will give different ranking of industries for different values of r . For instance, at Cr3, firm C is more concentrated than B. But at Cr6 market B is more concentrated than market C.

  18. The basic problem with Concentration ratio is that it provides no information about the size distribution of the r firmschosen for constructing the ratio. Suppose in industry A where there are four firms, the largest firm has 97% market share and the other three account for 1% each. In industry B there are four firms each with a market share of 25%. For both industries (A&B) Cr4 = 100% although the market structure is different. That is, market A is more or less a monopoly market.

  19. (ii)The Hirschman-Herfindahl (HHI)Index: Unlike the concentration ratio (Cr), the HHI takes into account all points on the concentration curve. HHI is the sum of the squares of the relative sizes (or market shares) of all firms in the market, where the relative sizes are expressed as proportions of the total size of the market. Mathematically, the HHI index is given by: n = i = 2 HHI i S 1

  20. Where Si = qi/Q, qi is output of ith firm and Q is total output of all the firms in the market, and n is the total number of firms in the industry. The index is close to zero when there is large number of equal sized firms, or equal to one under monopoly. The HHI has two principal advantages: Squaring the individual market shares gives more weight to the shares of the larger firms. It uses information about the market share of all relevant firms.

  21. The HHI gives added weight to the biggest industries. The higher the index, the more the market concentration and (within limits) the less open market competition. Example We have six firms in a given computer market. The following table shows the market share of the firm.

  22. S.N Name of a firm Market share in Square of market share percentage 20 1 Firm 1 0.04 2 Firm 2 15 0.0225 3 Firm 3 10 0.01 4 Firm 4 15 0.0225 5 Firm 5 25 0.0625 6 Firm 6 15 0.0225 Total 0.018

  23. Using the formula above, first you can compute the square of each market share of a given firm. After that just take the summation of the square of each market shares. It will give you the value of the Hirschman Herfindahl index. That is 0.018 the value indicates that monopoly power of the firms is very low.

  24. A Hirschman-Herfindahl index of S12 or 1002, or 10,000. By definition, that is the maximum score. By contrast, an industry with 100 competitors that each has 1% of the market would have a score of 12 + 12 + 12+ ... + 12 or a total of 100. The more typical situation might be a duopoly. If each of the two firms has a market share of 50%, theHirschman-Herfindahl index would be (50)2 + (50)2 = 2500 + 2500 = 5000. With two firms that have of 75% and 25% respectively, theHirschman-Herfindahl index would be: (75)2+ (25)2 = 5,625 + 625 = 6,250 monopoly, for example, would have

  25. In recognition of its advantage, the HHI has been accepted as a measure of concentration in the United State of America, especially as a guideline to decide merger cases. According to the guidelines to decide merger cases un-concentrated markets are defined, as those in which HHI is 1000 or less which is equivalent to 10 equal sized firms. In this situation mergers (at least two firms merged in each other) leading to a rise of HHI = 200 points are challenged or disallowed.

  26. A market is assumed to be concentrated if HHI is 1800 or more which is roughly equivalent to five equal sized firms. Each one has a share of 20%. In this case mergers leading to a 100 point or more rises in HHI are rejected or challenged. When two firms with market share of S1 and S2 merge the HHI increases by 2S1S2. The purpose of disallowing merger is that it may lead to a monopolysituation.

  27. iii. Entropy Index: it is quite recently to measure the degree of market concentration. Market concentrations are weighted by the logarithms of the market shares. It uses the following formula: 0< E < log (n) where EI is defined as 'Entropy coefficient.' 1 P n = log( ) EI P i = 1 i i

  28. It uses the formula where E is defined as Entropy Coefficient, Pi is the market share of ith firm and n the number of firm. This coefficient in fact measures the degree of market uncertainty faced by a firm in relation to a given customer. This will be the situation when number of firms is large enough, i.e., market is not concentrated. For a monopoly firm (n=1) the Entropy coefficient takes the value of zero which means no uncertainty and concentration. maximum there is

  29. Thus, we find inverse relationship between the Entropy coefficient (EI) and the degree of market concentration. If there are n firms, all equal in size, then: 1 log( ) i n = n = = log( ) EI n n 1 EI is similar to HHI, but the difference is that EI gives relatively more weight to the smaller firms. Numerical Example We have six firms in a given Mobile market. The following table shows the market share the firms.

  30. S.N Name of a Market share 1/Pi Log 1/Pi P1(log 1/Pi) firm In Percentage (Pi) 1 Firm 1 20 5 0.7 0.14 2 Firm 2 15 7 0.8 0.12 3 Firm 3 10 10 1 0.1 4 Firm 4 15 7 0.8 0.12 5 Firm 5 25 4 0.6 0.15 6 Firm 6 15 7 0.8 0.12 Total 0.75

  31. iv. The Dispersion method : is an index used to measure equality/ inequality using Gini coefficient (GC). It is used to plot cumulative market share against the cumulative percentage of firms. In this case, firms are cumulated from the smallest to the largest unlike that of the concentration curve. That is, the Gini (or Lorenz curve) shows the variation in cumulative percentage distribution of market share with cumulative distribution of firms from smallest to largest in the market (as shown in figure below).

  32. Fig: 3.2: The Lorenz Curve

  33. In figure 3.2, Line OA is line of perfect equality, representing equal sized firms. Curves 2 & 3 represent Lorenz Curve. Greater inequality results if Lorenz curve is farther from line of equality. Curve 3 thus reflects highest inequality. A coefficient which we may call 'Lorenz coefficient' or 'GINI-coefficient' is obtained by dividing the area bounded between the Lorenz curve (say curve-2) and the diagonal line OA { shown with rectangles in it } by the area of the triangle under the diagonal (OAC).

  34. That is, In all case, 0 < GC < 1; greater the magnitude of GC say 0.5, 0.6 or 0.7 higher inequality exists and vice versa. Limitation of Gini coefficient: one basic problem with GC is that it favors equality of market shares without regard to the number of equal sized firms, i.e. GC equal to zero for two firms with 50% market share each or 3 firms with 33.3% market share each, etc. Re ) 1 ( gion = GC OAC ( ) Area

  35. Thus, competition. But this is not always true because the level of competition differs with the number of firms but not equal size firms. Sufficient and accurate data about the market share of every firm in the market may not be available. GC=0 implies equal level of

  36. VI. The Lerner Index (LI): is the bestknown measure of monopoly power. It is expressed as: LI = = The greater the deviation between price & MC, the higher the monopoly power of the firm & the greater the market concentration. LI = 0 for perfect competition (since P=MC). Note that for profit maximization we have the familiar condition MR = MC, and MR = P (1- 1/e). Thus, from these two equations, we get the Lerner index as: Marginal - (P) Price cost (MC) - P MC Price (P) P

  37. By substitution, we have: P LI P = MR P MC P = Where e is the price elasticity of demand and hence, LI is the inverse of e, which is price elasticity of demand. P MC LI P 1 e = = + / P P P e P = = = ( / )/ p e 1/ L p e I

  38. Example: Suppose firms are operating in two markets: Market 1 where Price of the product is 100 birr and marginal cost of production is 25 birr and Market 2 where Price of the product is 50 birr and marginal cost of production is 20 birr Compute Learner index for both Market Which market is more concentrated?

  39. IV. The Elasticity Index The ratio of own elasticity of demand and cross elasticity of demand for a firm could be used as a measure of monopoly power or market concentration in terms of number equivalent i.e. e e ej ji = = 1 ii e or n ii 1 n i

  40. Where eii= own elasticity of demand eji and = cross elasticity of demand. An increase in the ratio means lesser number of firms in the market and a decrease means higher number.

  41. Example The product own elasticity of demand of a commodity was 0.15 and cross demand elasticity of the product was 0.60. The number of the firm in this year was ten. Compute the elasticity index e e e = = 1 ii + ii e or n ii 1 1 n ji = = 0.25 1.25 n This indicates the ratio is very high or the number of firms is very less.

  42. 3.4 Concentration and the market performance We know that a firm with substantial monopoly power will tend to: charge higher price produce and sell less output make high rate of profit grow faster than others capable of doing anything it wants in connection with its business such as: R & D, advertisement, etc. If we assume that concentration is appropriate measure of monopoly power, we are then in a position to verify the various propositions of the economic theory which reflects the relationship between concentration and market performance of the firm.

  43. i. Concentration and profit: a firm derives the market power or monopoly power in the situation of concentration. Such a market power, through market conducts activities or directly leads to an increase to profitability of the firm. It is frequently assumed that persistence of high rates of profits over a long period of time is the consequence of high degree of intra-industry concentration. Bain was the first to make empirical study on the relationship between concentration and profit.

  44. He argued that there is strong linkage between the two and hence profit rate can be a measure of concentration. However, there are establishing the correct relationship between concentration and profit as both are subject to ambiguities of measurements. For example, since we do have various measures of concentration, we do not know which one is the best measure of concentration. If one measure of concentration is selected, it may have strong correlation with profit but if another indicator of concentration is used it may have weak correlation with profit. some difficulties in

  45. Further, the measurement of profit is not free from weaknesses. For example, it is often based on accounting data which ignores certain opportunity cost elements that are related to own fund, own building and own entrepreneurial ability. All in all, there is positive relationship between profit rate and degree of market concentration on the basis of theoretical logic, though the very precise estimation of which is yet to come. ? Researchable area????????????????????

  46. ii. Concentration and Price Cost Margins: Price margin is another way to define profitability. It is a short term view of profitability based on current assets and cost figures. Average price cost margin is just a ratio of these two magnitudes. Some empirical studies supported the positive relationship between concentration and price- cost margin. However, some other insignificant relationships between the two variables. ? Need a research. Hence, think over it.??????? studies indicate

  47. iii. Concentration and growth of the firm: there are two different views (streams of thoughts) to explain the actual concentration and growth. First view: a firm with the market power may prefer to maintain its high rates of profits by restricting output and charging high price. If it grows, it has to scarify some profit margin and lower price which may not be in its interest. Moreover, there will be all kinds of government restrictions to stop further growth of the firm. relationship between

  48. Static diseconomies of scale and other bottle necks all adversely affect the growth of such a firm. Thus, we expect thehigher the monopoly power, the lesser may be the growth of the firm. Second view: sees positive relationship between concentration and growth of the firm. To maximize the long term profit, firms may like to grow over time even under market concentration. They may create excess capacity to meet the future growing demand and to discourage new entry in the market. For these firms may sacrifice some profit to stimulate long term growth. Thus, we find a case for positive relationship between initial market concentration and growth of the firm.

  49. iv. Concentration and Technological Progress we know thatfew firms that enjoy monopoly power in concentrated industries will be large enough. They will be having stability, financial resource and ability to initiate the process of R& D and again the benefit from them. Some recent researches show the situation when the market is concentrated and innovative activities are positively correlated. However, there is no conclusive empirical evidence to prove such proposition. ???? You call for research???????????

  50. Some argue that it may not be the concentration but the other attributes of market structure like the size of the firm, product differentiation possibilities that may be having collinearity with concentration and thus causing a spurious positive correlation between concentration and technological change. Nothing can be said in either way about the relationship. It is open for further empirical verification. Ditto??????????????????

More Related Content

giItT1WQy@!-/#giItT1WQy@!-/#giItT1WQy@!-/#giItT1WQy@!-/#giItT1WQy@!-/#giItT1WQy@!-/#giItT1WQy@!-/#giItT1WQy@!-/#giItT1WQy@!-/#