Logistic Knowledge Tracing: A Deep Insight
Logistic Knowledge Tracing (LKT) is a robust framework based on logistic regression that delves into assessing a student's latent skills during the learning process. Unlike traditional methods, LKT focuses on probabilistic correctness rather than direct skill expression, making it a valuable tool for evaluating a student's knowledge on various topics. This method differs from Bayesian Knowledge Tracing (BKT) by incorporating multiple skills with varied learning rates and introduces a difficulty parameter for precise evaluation. Through PFA (Performance Factors Analysis), educators can measure a student's skill acquisition in real-time, making it indispensable for adaptive learning environments.
Uploaded on Mar 08, 2025 | 2 Views
Download Presentation

Please find below an Image/Link to download the presentation.
The content on the website is provided AS IS for your information and personal use only. It may not be sold, licensed, or shared on other websites without obtaining consent from the author.If you encounter any issues during the download, it is possible that the publisher has removed the file from their server.
You are allowed to download the files provided on this website for personal or commercial use, subject to the condition that they are used lawfully. All files are the property of their respective owners.
The content on the website is provided AS IS for your information and personal use only. It may not be sold, licensed, or shared on other websites without obtaining consent from the author.
E N D
Presentation Transcript
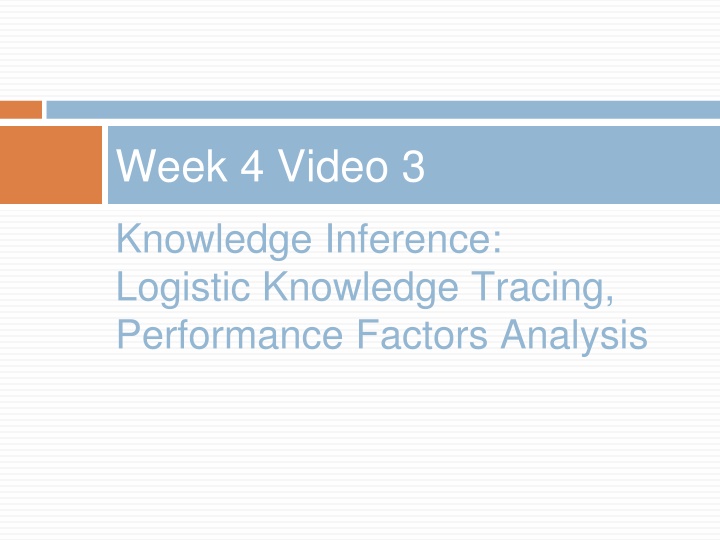
Week 4 Video 3 Knowledge Inference: Logistic Knowledge Tracing, Performance Factors Analysis
Logistic Knowledge Tracing A broad framework for knowledge tracing models based on logistic regression (Pavlik et al., 2021)
Performance Factors Analysis First member of the LKT family that ran in real- time (Pavlik et al., 2009)
PFA Measures how much latent skill a student has, while they are learning But expresses it in terms of probability of correctness, the next time the skill is encountered No direct expression of the amount of latent skill, except this probability of correctness
What is the typical use of PFA? Assess a student s knowledge of topic X Based on a sequence of items that are dichotomously scored E.g. the student can get a score of 0 or 1 on each item Where the student can learn on each item, due to help, feedback, scaffolding, etc.
Key assumptions Each item may involve multiple latent skills or knowledge components Different from BKT Each skill has success learning rate and failure learning rate Different from BKT where learning rate is the same, success or failure
Key assumptions There is also a difficulty parameter , but its semantics can vary more on this later From these parameters, and the number of successes and failures the student has had on each relevant skill so far, we can compute the probability P(m) that the learner will get the item correct
Reasonable Example = 0.2, = 0.1, = -0.5 Actual m P(m)
Reasonable Example = 0.2, = 0.1, = -0.5 Actual m P(m) 0.38 -0.5
Reasonable Example = 0.2, = 0.1, = -0.5 Actual 0 m P(m) 0.38 -0.5 -0.5+(0.1*1)
Reasonable Example = 0.2, = 0.1, = -0.5 Actual 0 m P(m) 0.38 -0.5 -0.5+0.1
Reasonable Example = 0.2, = 0.1, = -0.5 Actual 0 m P(m) 0.38 0.40 -0.5 -0.4
Reasonable Example = 0.2, = 0.1, = -0.5 Actual 0 0 m P(m) 0.38 0.40 -0.5 -0.4
Reasonable Example = 0.2, = 0.1, = -0.5 Actual 0 0 m P(m) 0.38 0.40 -0.5 -0.4 -0.5+(0.1*2)
Reasonable Example = 0.2, = 0.1, = -0.5 Actual 0 0 m P(m) 0.38 0.40 -0.5 -0.4 -0.5+0.2
Reasonable Example = 0.2, = 0.1, = -0.5 Actual 0 0 m P(m) 0.38 0.40 -0.5 -0.4 -0.3
Reasonable Example = 0.2, = 0.1, = -0.5 Actual 0 0 m P(m) 0.38 0.40 0.43 -0.5 -0.4 -0.3
Reasonable Example = 0.2, = 0.1, = -0.5 Actual 0 0 1 m P(m) 0.38 0.40 0.43 -0.5 -0.4 -0.3
Reasonable Example = 0.2, = 0.1, = -0.5 Actual 0 0 1 m P(m) 0.38 0.40 0.43 -0.5 -0.4 -0.3 -0.5+(0.1*2)+(0.2*1)
Reasonable Example = 0.2, = 0.1, = -0.5 Actual 0 0 1 m P(m) 0.38 0.40 0.43 -0.5 -0.4 -0.3 -0.5+0.2+0.2
Reasonable Example = 0.2, = 0.1, = -0.5 Actual 0 0 1 m P(m) 0.38 0.40 0.43 0.48 -0.5 -0.4 -0.3 -0.1
Degeneracy in PFA (Maier et al., 2021) Three degenerate cases 1. < 0 2. < 3. = = 0
Degeneracy in PFA (Maier et al., 2021) Three degenerate cases 1. < 0 2. < 3. = = 0 One seemingly degenerate (but not) case 4. > 0 It is worth noting that a fourth case when > 0 -- is not degenerate, due to the multiple functions the parameters perform in PFA. In this case, the rate of learning the skill may outweigh the evidence of lack of student knowledge that an incorrect answer provides. So long as > , a positive is conceptually acceptable.
Degenerate Example (Case 1) = -0.1, = -0.5, = -0.5 Actual 0 0 1 m P(m) 0.38 0.27 0.18 0.17 -0.5 -1 -1.5 -1.6
Degenerate Example (Case 2) = 0.1, = 0.2, = -0.5 Actual 0 0 1 m P(m) 0.38 0.43 0.48 0.5 -0.5 -0.3 -0.1 0
Note Values of below 0 don t actually mean negative learning They mean that failure provides more evidence on lack of knowledge Than the learning opportunity causes improvement
Addressing Degeneracy (Maier et al., 2021) Simply bound and Does not reduce model performance substantially (just like BKT) What causes degeneracy? We ll come back to this in a minute
Note Parameters in PFA combine information from correctness with improvement from practice improvement Makes PFA models a little harder to interpret than BKT
Adjusting = 0.2, = 0.1, = -0.5 Actual 0 0 1 m P(m) 0.38 0.40 0.43 0.48 -0.5 -0.4 -0.3 -0.1
Adjusting = 0.2, = 0.1, = -1.5 Actual 0 0 1 m P(m) 0.18 0.20 0.21 0.25 -1.5 -1.4 -1.3 -1.1
Adjusting = 0.2, = 0.1, = +3.0 Actual 0 0 1 m 3.0 3.1 3.2 3.4 P(m) 0.953 0.957 0.961 0.968
Parameters Pavlik proposes three different Parameters Item Item-Type Skill Result in different number of parameters And greater or lesser potential concern about over-fitting
Causes of Degeneracy (Maier et al., 2021) If is used at the Skill or Item-Type level And the learning system moves students from easier to harder items within a skill Then < 0. Also, if items are tagged with multiple skills, shared variance (collinearity) between skills could produce degenerate parameters.
Fitting PFA Typically Expectation Maximization is used
Expectation Maximization 1. Starts with initial values for each parameter 2. Estimates student correctness at each problem step 3. Estimates params using student correctness estimates 4. If goodness is substantially better than last time it was estimated, and max iterations has not been reached, go to step 2
Expectation Maximization EM is vulnerable to local minima Randomized restart typically used
Is PFA better than BKT? Approximately equal predictive power across a lot of studies (Pavlik et al., 2009; Gong et al., 2010; Baker et al., 2011; Pardos et al., 2011, 2012) Different virtues and flaws choose the one that better fits your goals
Is PFA used in the real world? Yes, but by far fewer learning systems than BKT Maier et al. (2021) discuss its use in Reveal Math 1
Using PFA in the real world One issue in real-world use is handling rare skills, which can impact model inferences on common skills as well Because PFA is used in cases with items tagged to multiple skills (Maier et al., 2021) handle this by creating a catch all skill for rare skills Using average parameters from all common skills also works
Final Thoughts on PFA PFA is a competitor for measuring student skill, which predicts the probability of correctness rather than latent knowledge Can handle multiple KCs for the same item, a big virtue
PFA-Decay (Gong et al., 2011) Weights actions further back in order less strongly Adds an evidence decay parameter Substitutes For the previous summation Very slightly higher AUC (0.003)
R-PFA (Galyardt & Goldin, 2014) Weights actions further back in order less strongly Looks at proportion of success-failure, weighting by distance in order from current action Adds an evidence decay parameter b Adds ghost practices before current practice to make math work Substitutes For the previous summation A little higher AUC (0.003-0.027) (Pavlik et al., 2021)
LKT (Pavlik et al., 2021) Creates a general framework for variants of PFA
LKT (Pavlik et al., 2021) Ongoing work on variants to PFA typically frames itself in terms of LKT components (and proposes additional components) Examples Fluctuation in response time (Chu & Pavlik, 2023) Different models of memory decay and spacing effect (Maier et al., 2023)
Next Up Item Response Theory
